From The Lab: ES Daily 1368% (Return/Max Drawdown) – Proven Since 1997
This daily ES model has run since 1997 and delivered 1368 percent return to drawdown using one single contract with no compounding

This is a daily model for S&P 500 futures. It buys deep dips while momentum is still down.
Now I know what you’re thinking, aren’t we just buying a “falling knife”?
The bet is mean reversion: in ES, strong sell-offs often bounce back toward the average, and this model capitalises on that move.
It has held up since 1997, including through black-swan events.
Risk is managed with ADX: if trend strength isn’t there or fades, we cut quickly. That check gives us an answer within about one bar, either strength meets our threshold and we keep the position, or it doesn’t and we exit.
Simple idea. Clear rules. Short holds.
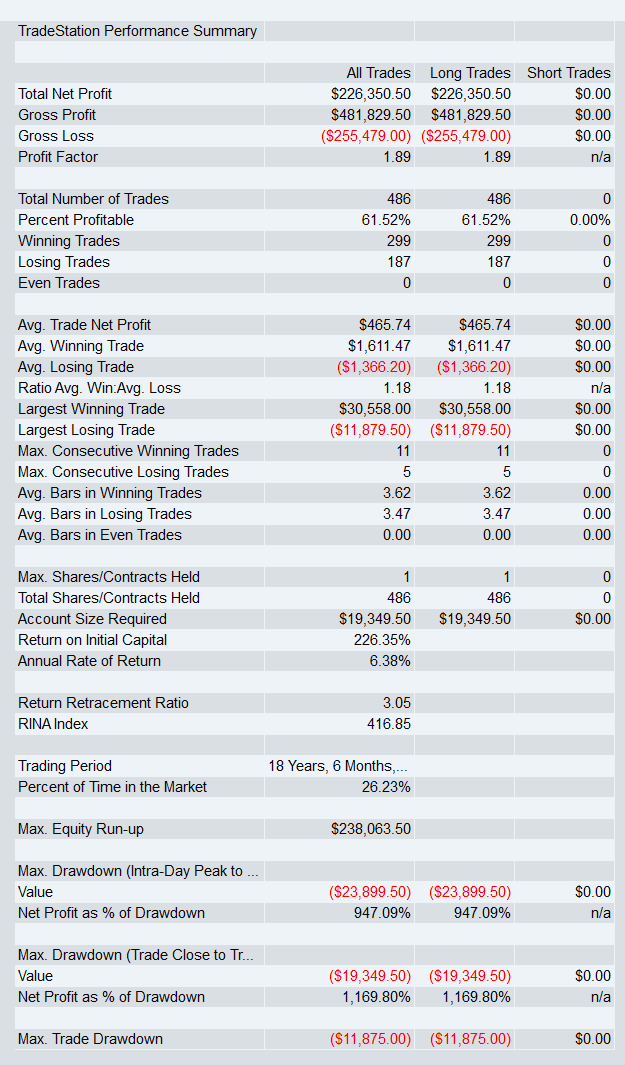
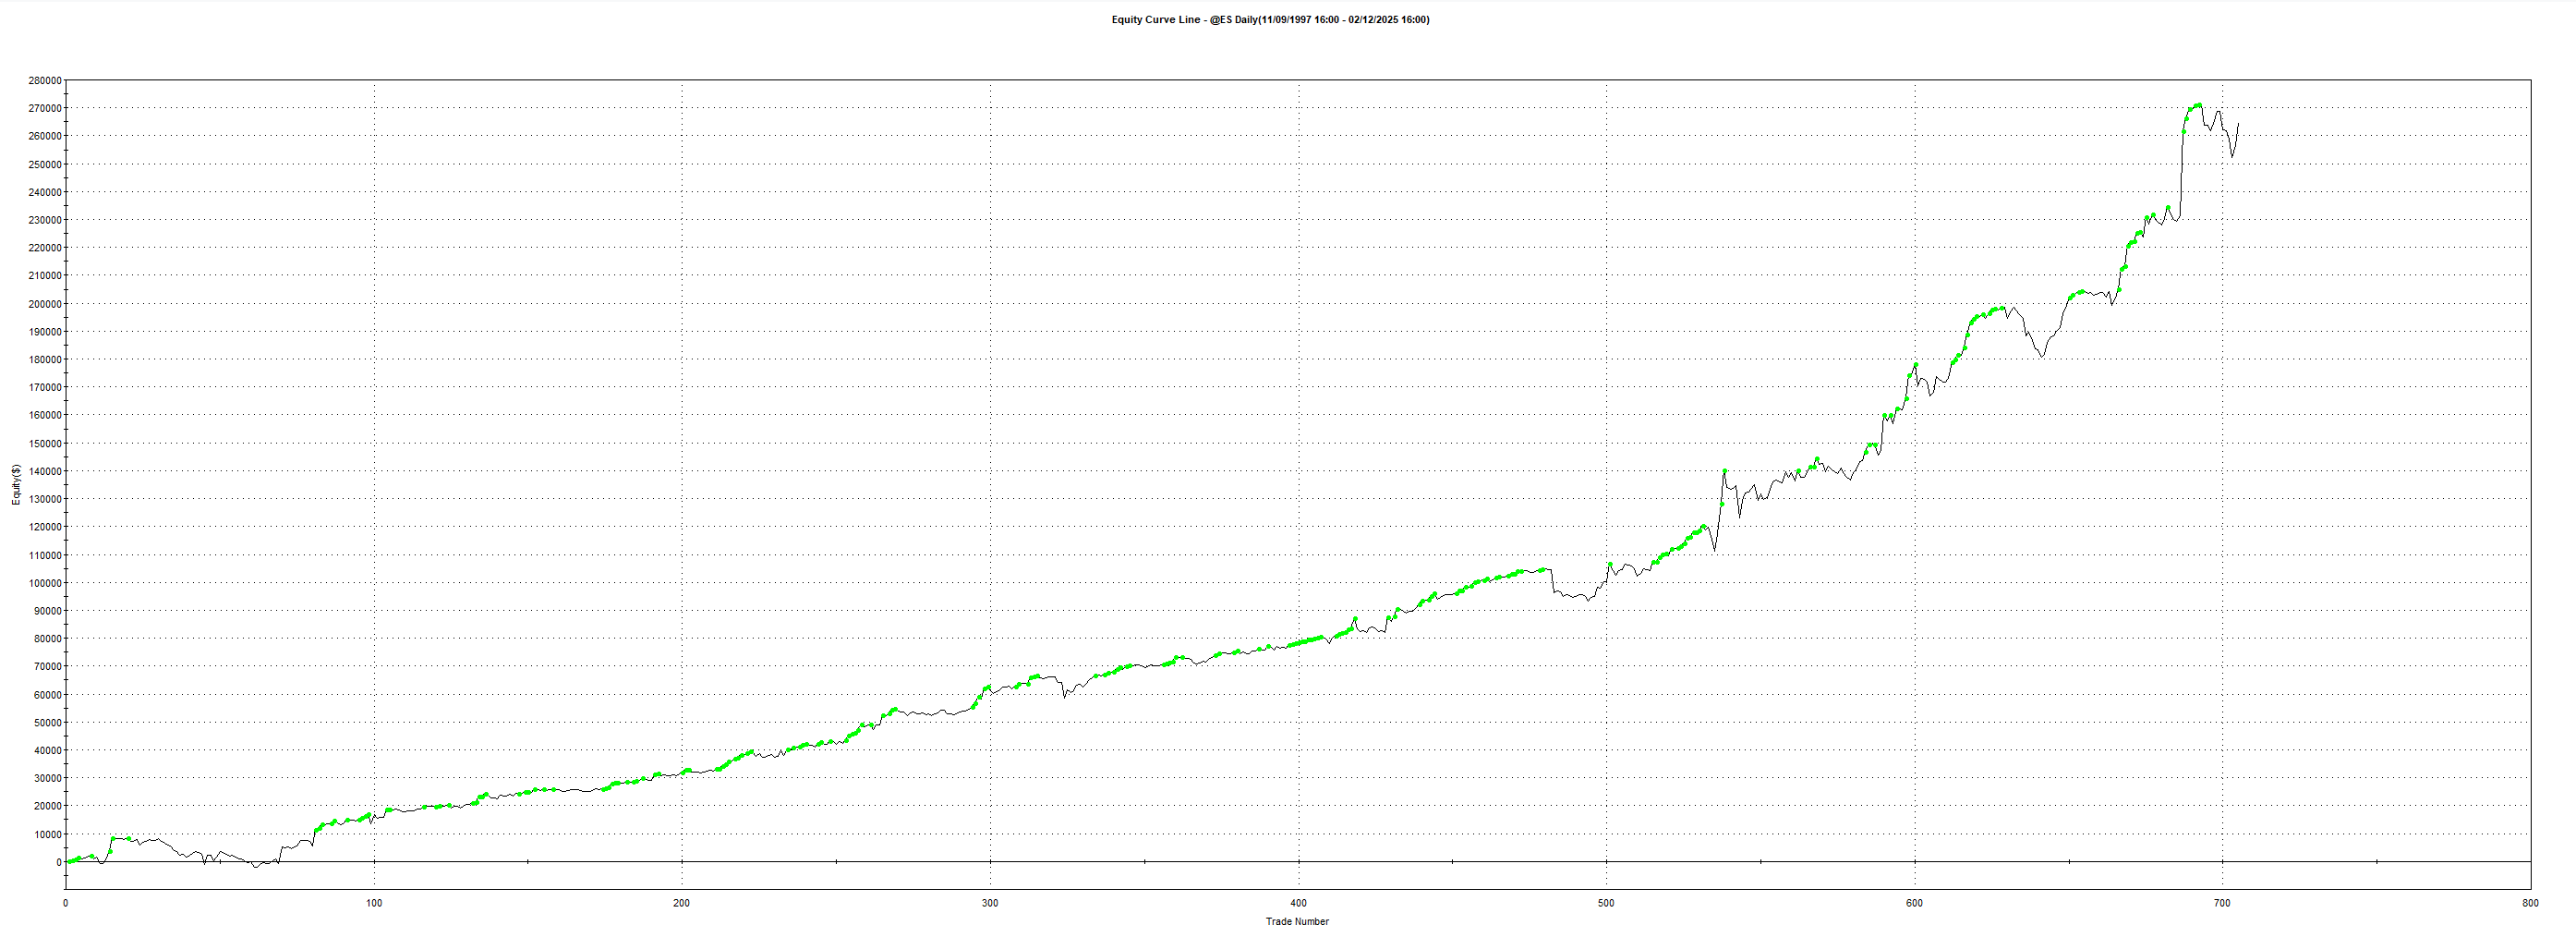
This simple model produced a profit factor of 1.85 and a 1,368 percent return on max drawdown, with an average trade of $375 across 27 years and 9 months. All results use a fixed size of one contract with no compounding so comparisons remain fair across the full sample.
Why ES for mean reversion: Edge Lab profiling shows ES performs best with long-side mean reversion. After sharp down days it often overshoots and then snaps back once urgent selling dries up. If you want more on Edge Lab, see the article below.

🧭 The setup
One. Location. Only act when price is deeply oversold for the recent window.
Two. State. We buy while weakness is still present.
Three. Entry. Take the trade only when both conditions align on the same day.
Four. Exits. Risk is managed with ADX: if strength isn’t there or it fades, we cut quickly. We also use a time cap and a protective stop.
📈 Results of strategy

🧷 Robustness testing
I trust results only after they pass the usual Stress tests.
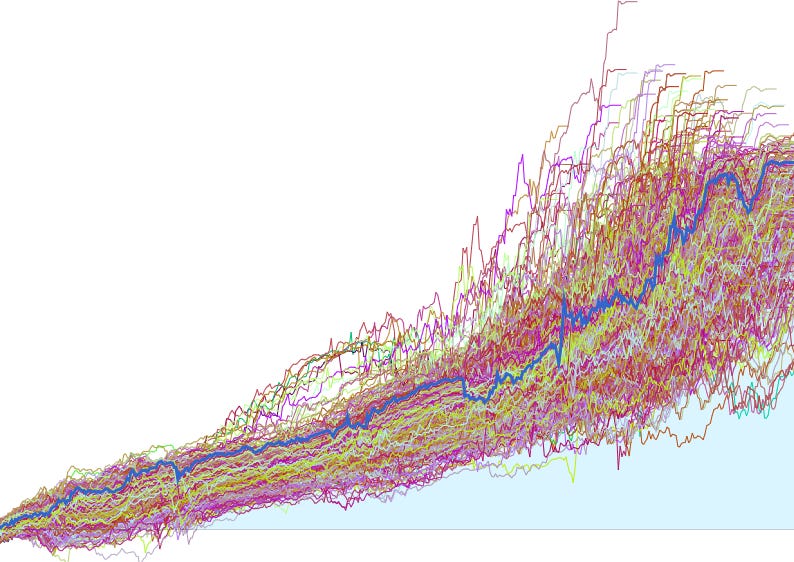
Monte Carlo parameters
We vary the parameters to test stability; if performance holds, it’s a green flag that the strategy isn’t reliant on precise settings.
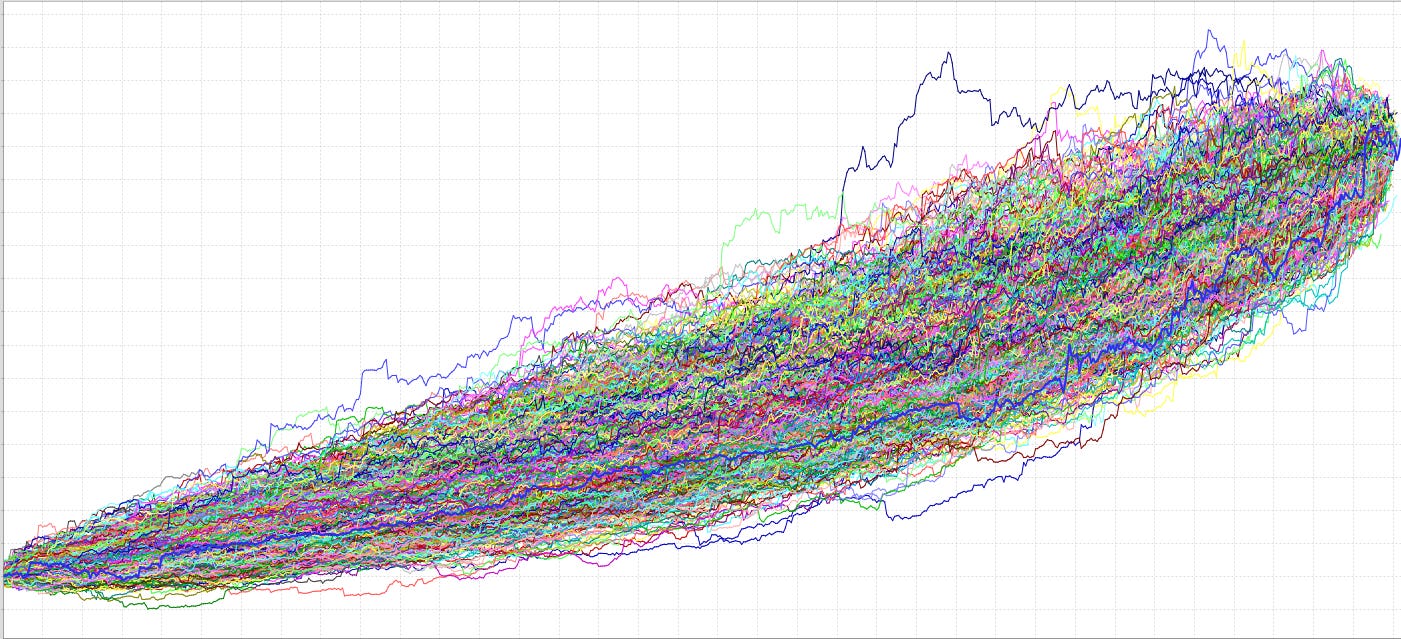
Monte Carlo extreme parameter stress test
In this test we are more looking to see what happens if we stretch the parameters to see if the strategy falls apart.
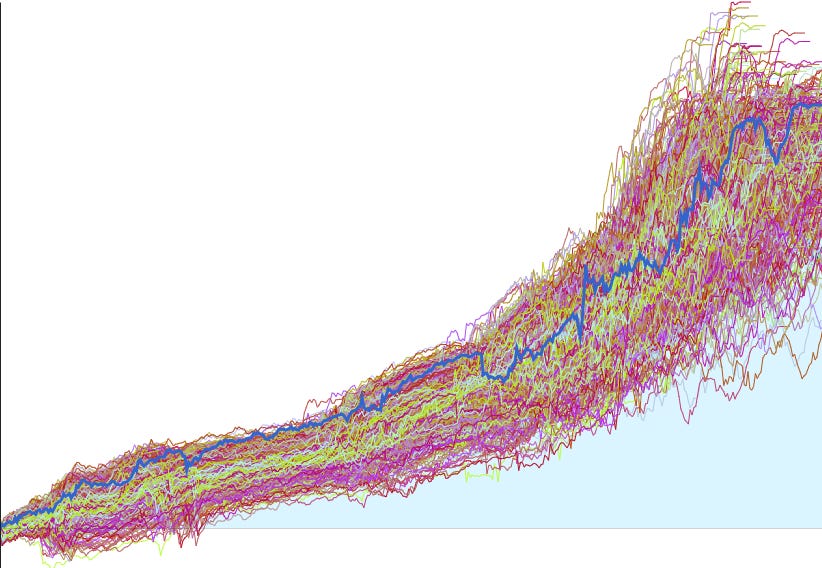
Monte Carlo randomise and skip trades
We shuffle the order of historical trades and randomly remove some to mimic misses, slippage, or bad fills. If performance stays healthy, the edge is not just luck in trade order. In this situation we are in the lower percentile which shows that we are not over optimistic in the results
Extended out of sample equity (Since 1997. This is the first time the model is seeing data before 2007. This run is a single pass with no touching.)
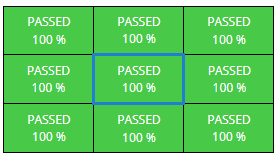
Walk Forward Matrix
We split history into rolling windows, select parameters on one window, then run the next window out of sample. Consistent results across many windows mean the model adapts rather than being overfit on the data.
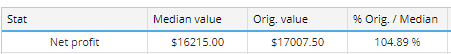
System Parameter Permutation test
We run many nearby parameter combinations around the chosen parameters. If most versions work, the model is stable and not tuned to one narrow sweet spot. As you can see our net profit on the model is within the Median value which is a sign the model isnt lucky.
Results on alternative market (To check if robust or overfit) run on NQ since 1999
We apply the same model on Nasdaq futures without adjusting the model (raw out of sample). If the results are acceptable, the idea is general and not tied only to ES.
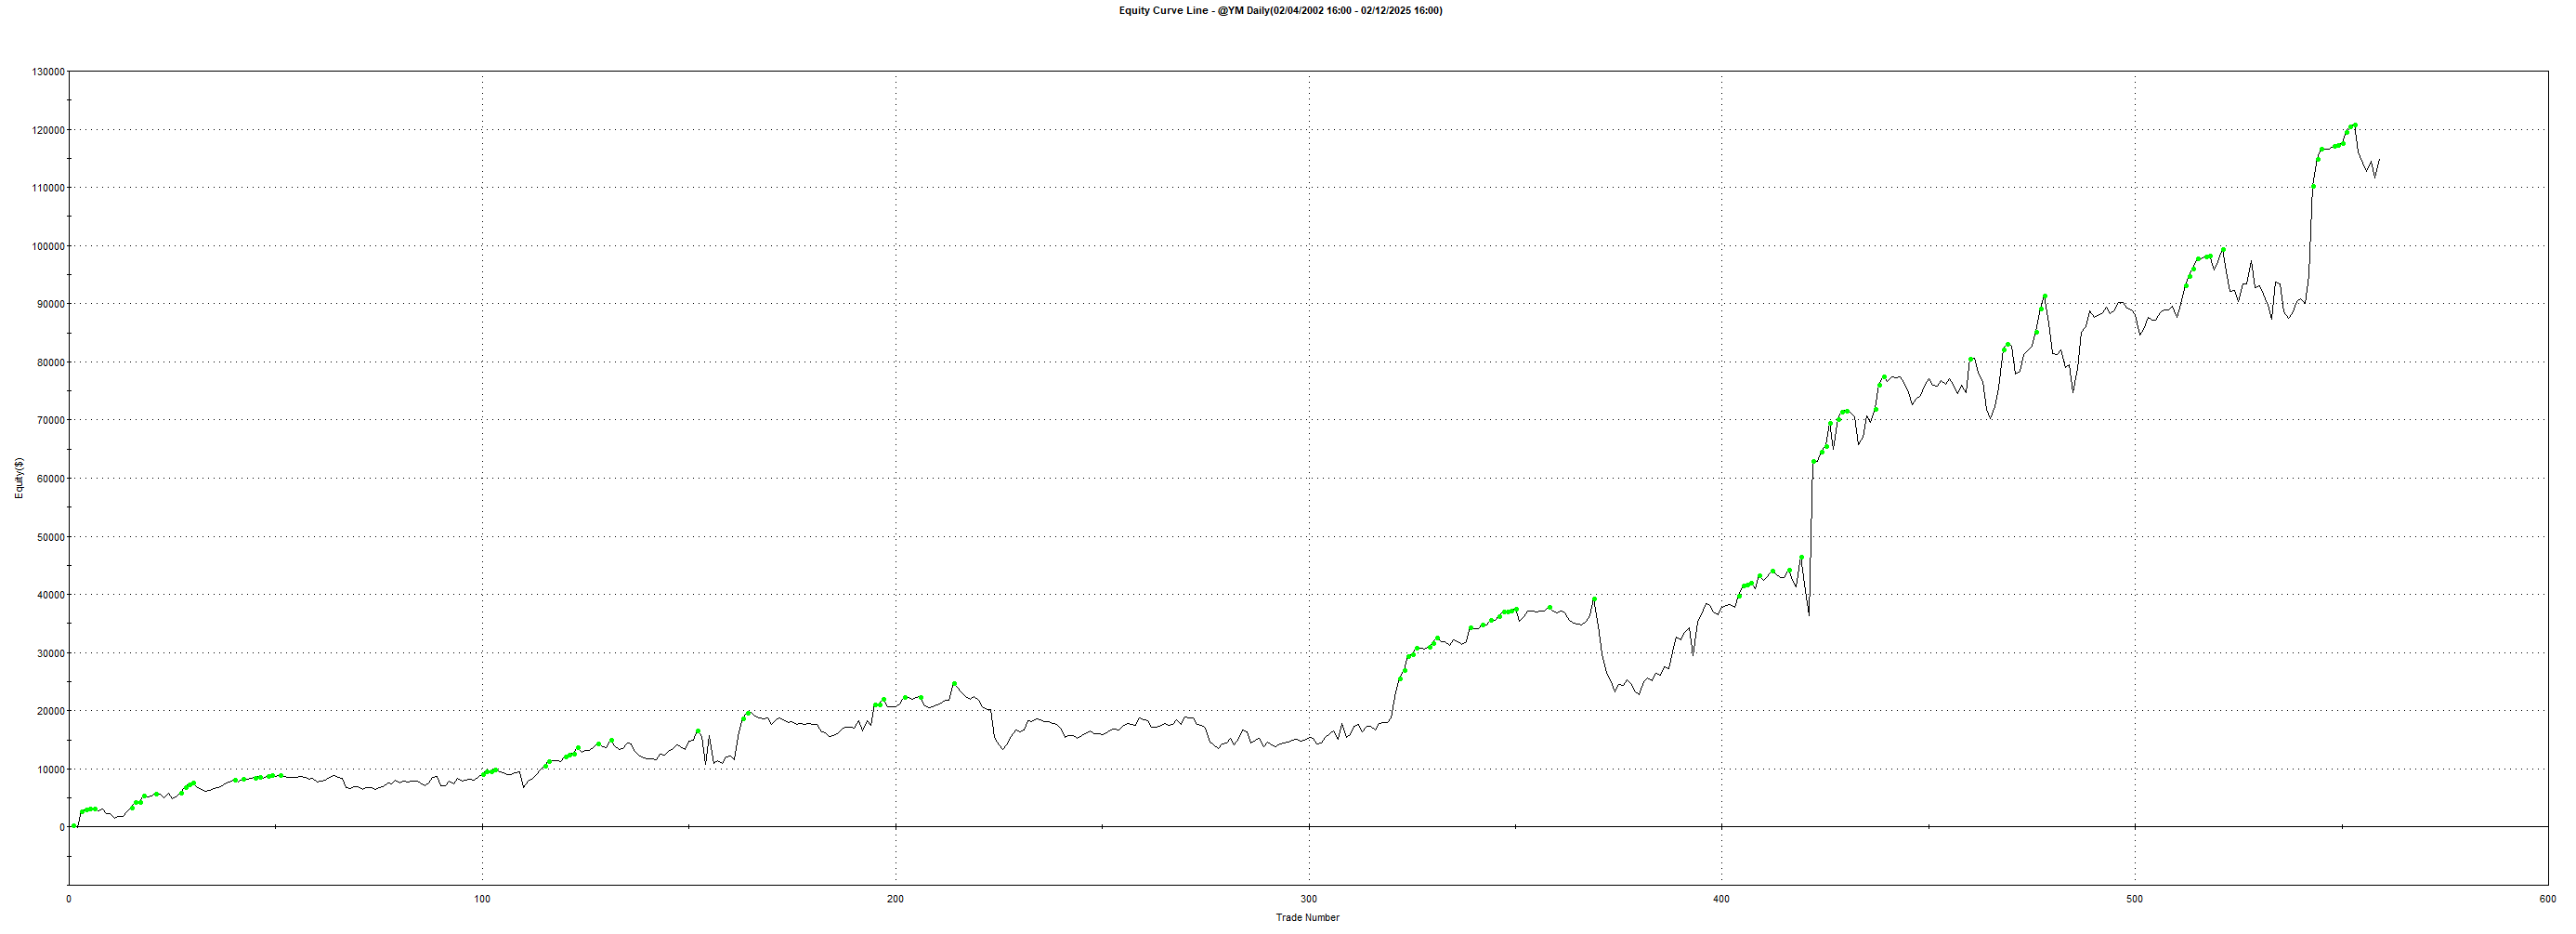
Results on alternative market (To check if robust or overfit) run on YM since 2002
We repeat the check on Dow futures without retuning. If it still holds up, that is further evidence the model is robust rather than overfit.
🛡️ MAE and the stop
Stops are for safety. I place the stop where normal noise ends and failure begins using the MAE picture. The time exit remains the main way out. The stop is there to cap the tail.
Ready to put it to work? The full EasyLanguage code is below.
Dont forget this code can be easily converted to any other trading platform using LLMs and of course this can be run on Micro ES aswell.
