From The Lab: NQ Daily 1642% (Return/Max Drawdown) – Proven Since 1999
This daily NQ model has run since 1999 and delivered 1642 percent return to drawdown using one single contract with no compounding

Today I am sharing a simple daily model for Nasdaq futures. The objective is to buy weakness that shows support, exit quickly, and keep risk defined. Clear rules. Short holds.
🧭 The setup
Nasdaq is explosive and prone to false breakouts. This model only participates after a controlled pullback with a clear support, then exits quickly before momentum stalls.
One. Volatility envelope. A Bollinger Band gives us the recent range. When price pulls back below the upper band after a trend, it signals a return toward normal conditions.
Two. Support signal. Wait for a three bar pattern. The middle bar makes the lowest low and the bars on both sides make higher lows, think small V. This is called a fractal down pattern.
Three. Entry. Buy only when both are present: the envelope pullback and the small V. In plain terms, buy the dip only when price is back inside its recent range and a floor is visible.
Four. Exit rules. Close the trade when one of these happens first. The rebound is stretched versus its recent average (our meter around 3.7), or two trading days pass.

🧠 Rules in plain English
Buy when the market has pulled back inside its recent range and a clear floor forms. Sell when momentum gets too strong or after two days. Cut the trade if the protective stop is reached.
🎯 Why this fits NQ
NQ is fast and it throws many failed breaks. The volatility envelope helps avoid chasing extended highs, and the fractal down confirms support before entry.
We takes profits when the push is stretched.
The two day time exit prevents handing gains back if momentum fades.
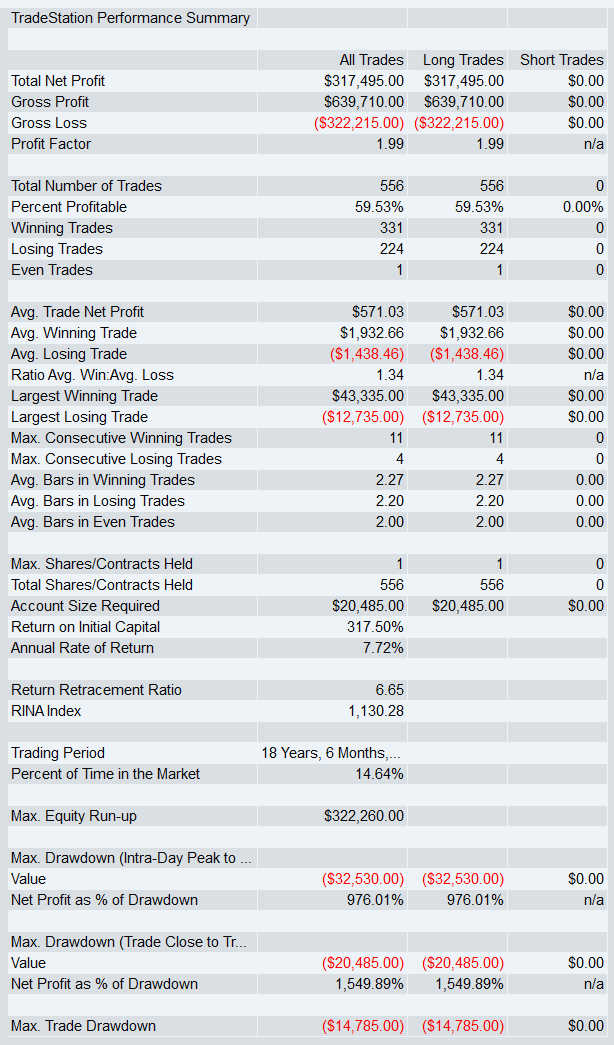
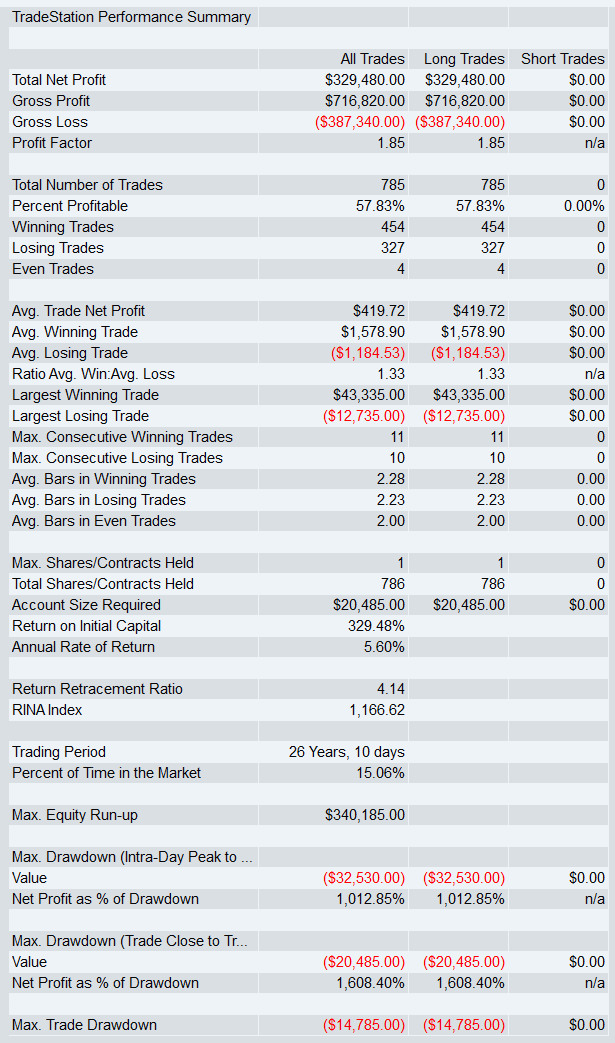
📈 Results of strategy
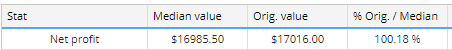
Since 2007 the model shows a 1549 percent return to max drawdown ratio.
For clean, comparable results, everything is tested at one contract with no compounding. CAGR will look lower under this constraint, but it preserves a fair, time consistent evaluation.
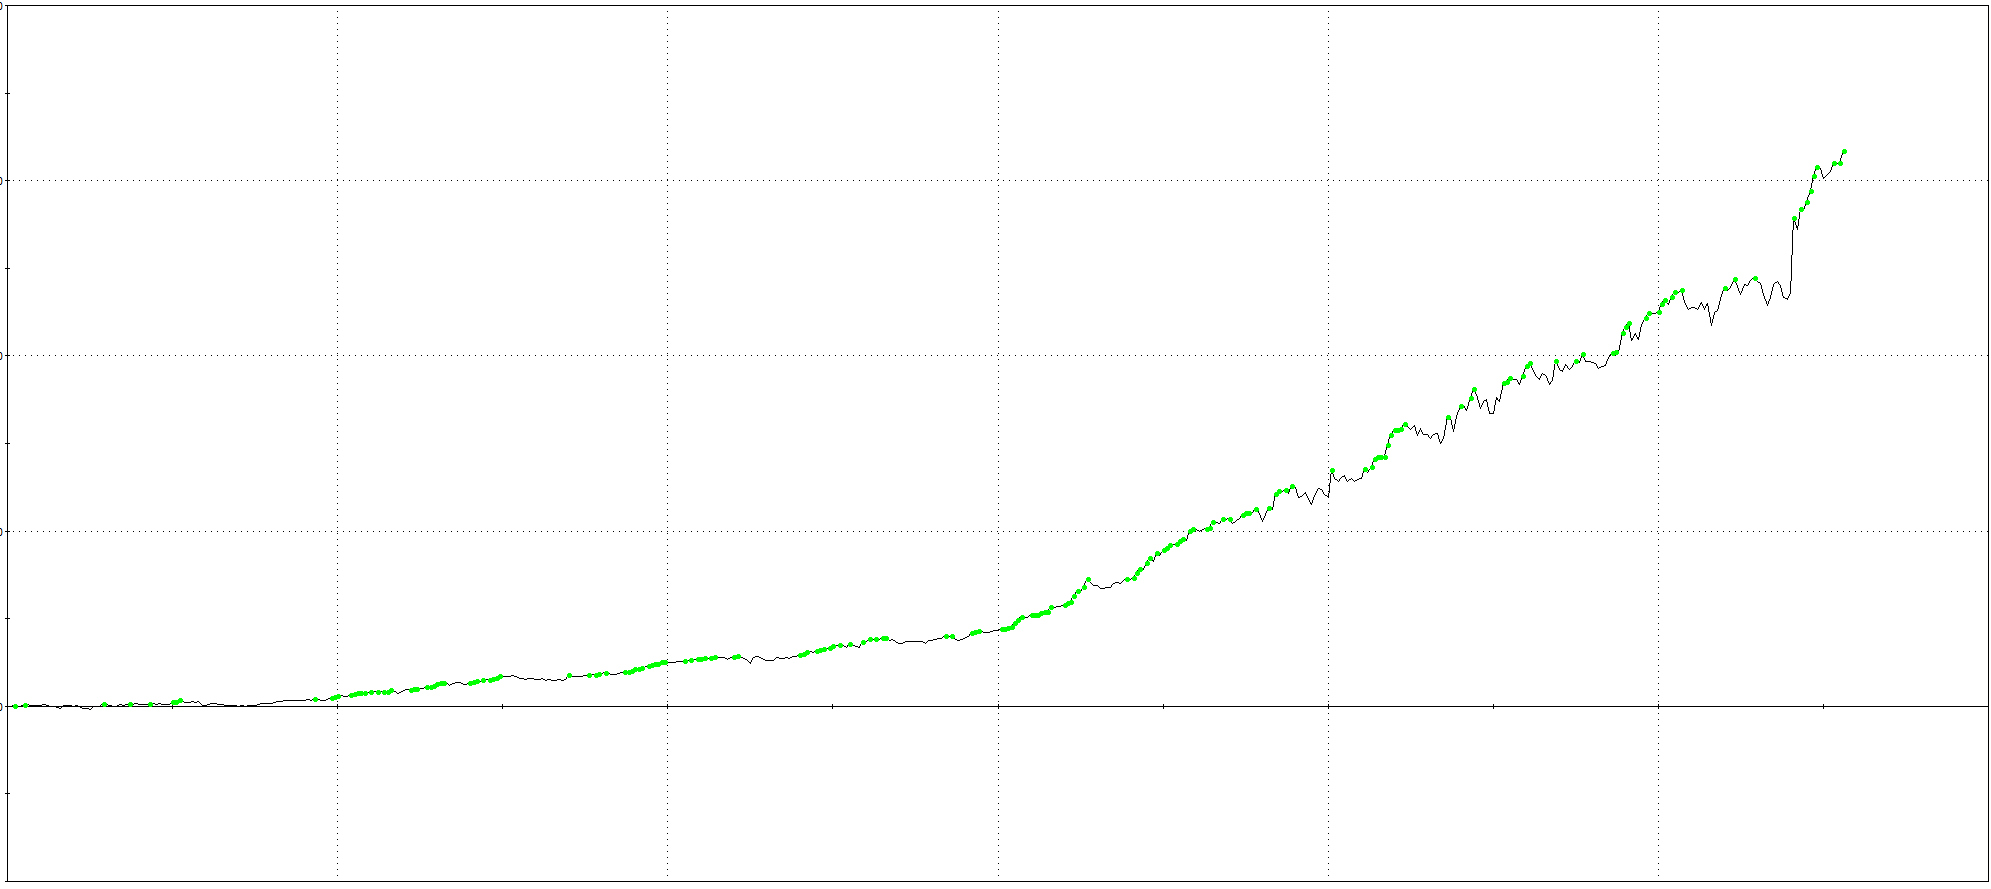
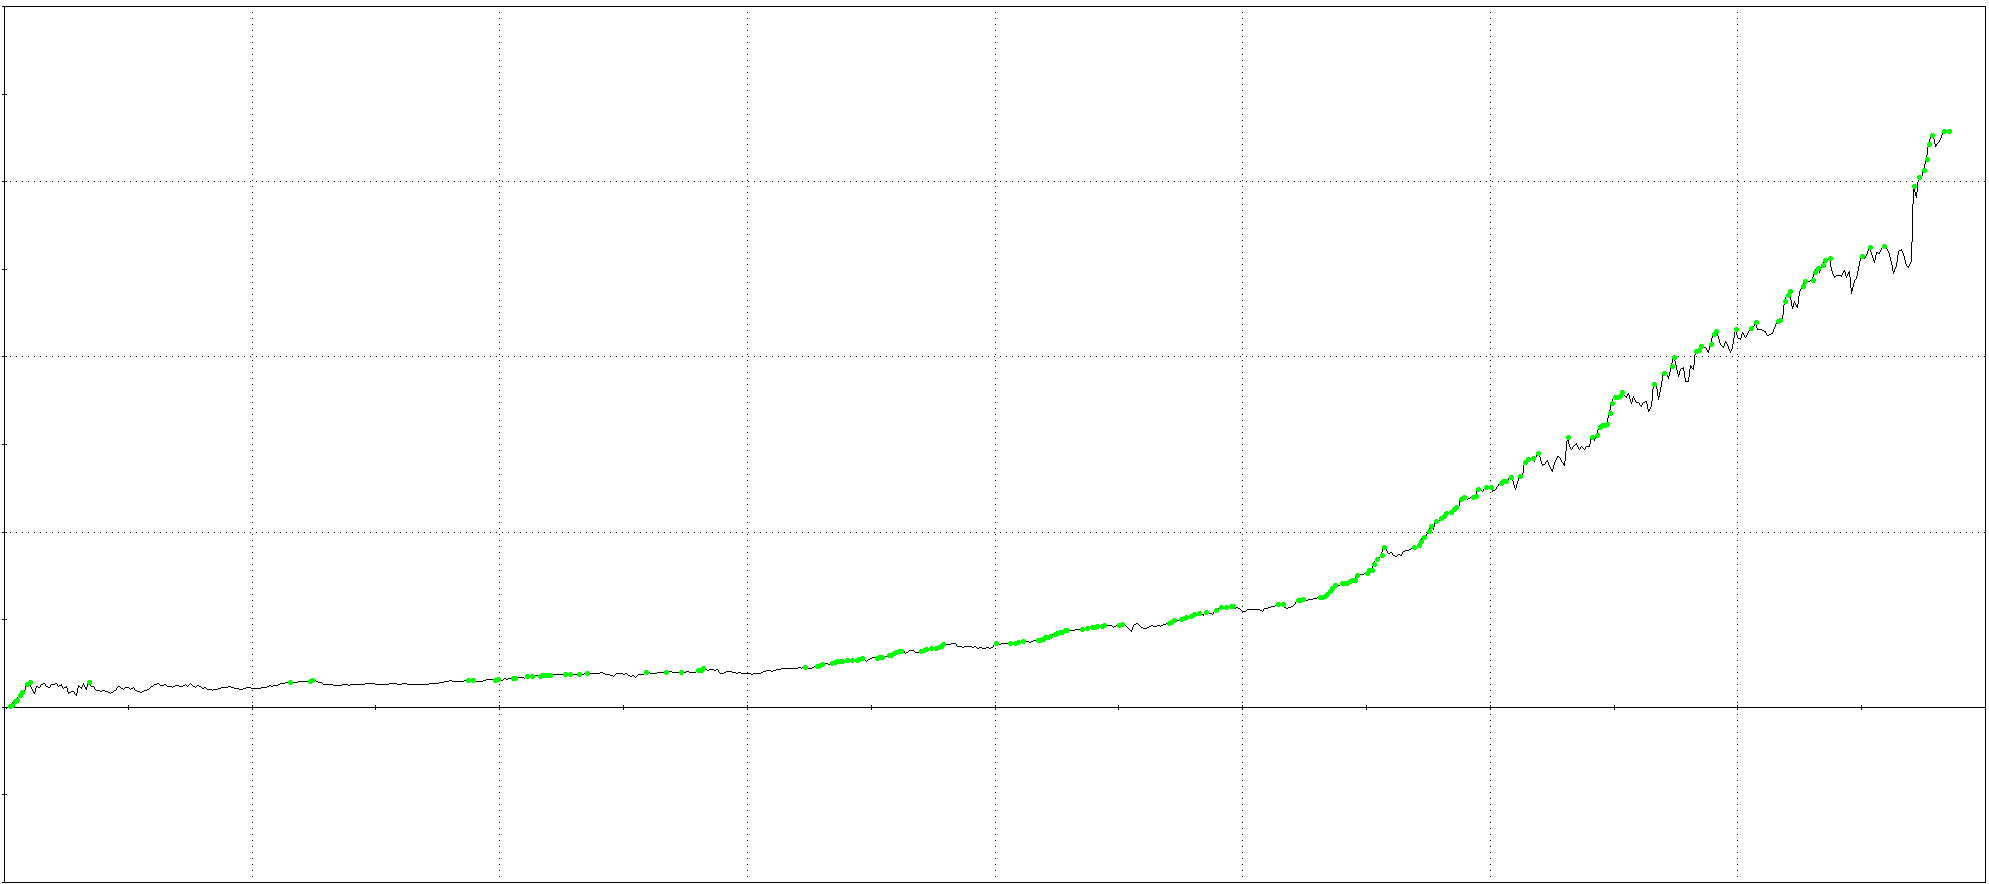
Equity of strategy on daily bars from 2007
🧷 Robustness testing
I trust results only after they pass the usual Stress tests.
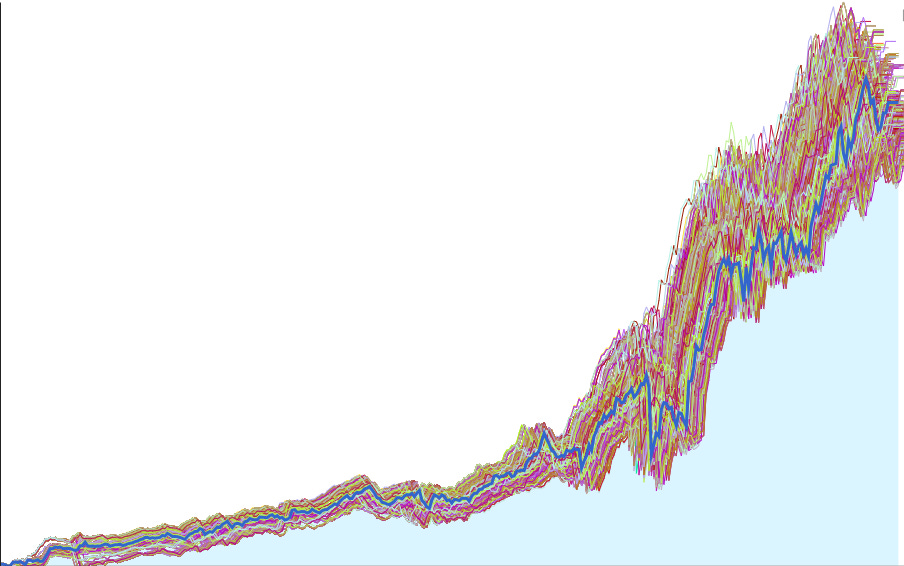
Monte Carlo parameters
We vary the parameters to test stability; if performance holds, it’s a green flag that the strategy isn’t reliant on precise settings.
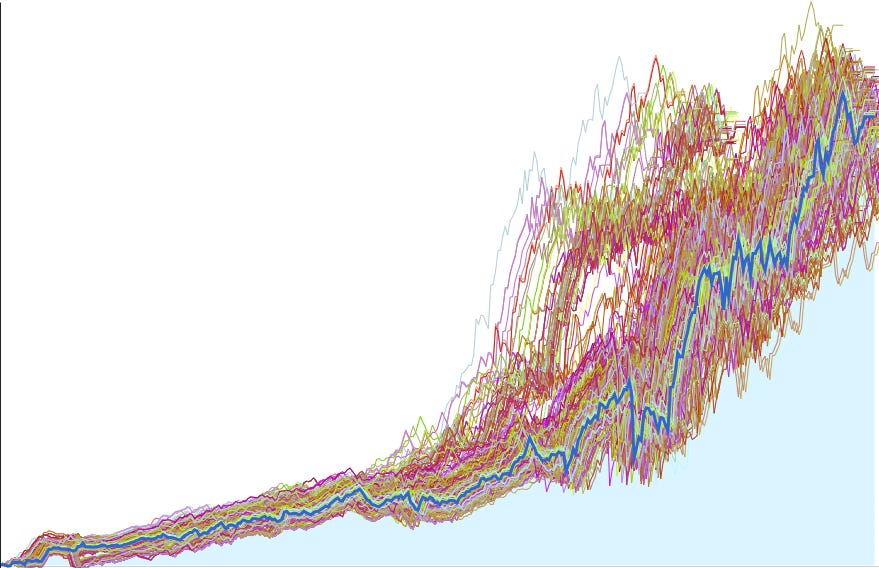
Monte Carlo extreme parameter stress test
In this test we are more looking to see what happens if we stretch the parameters to see if the strategy falls apart. As you can see it still holds up. (some even overperform)
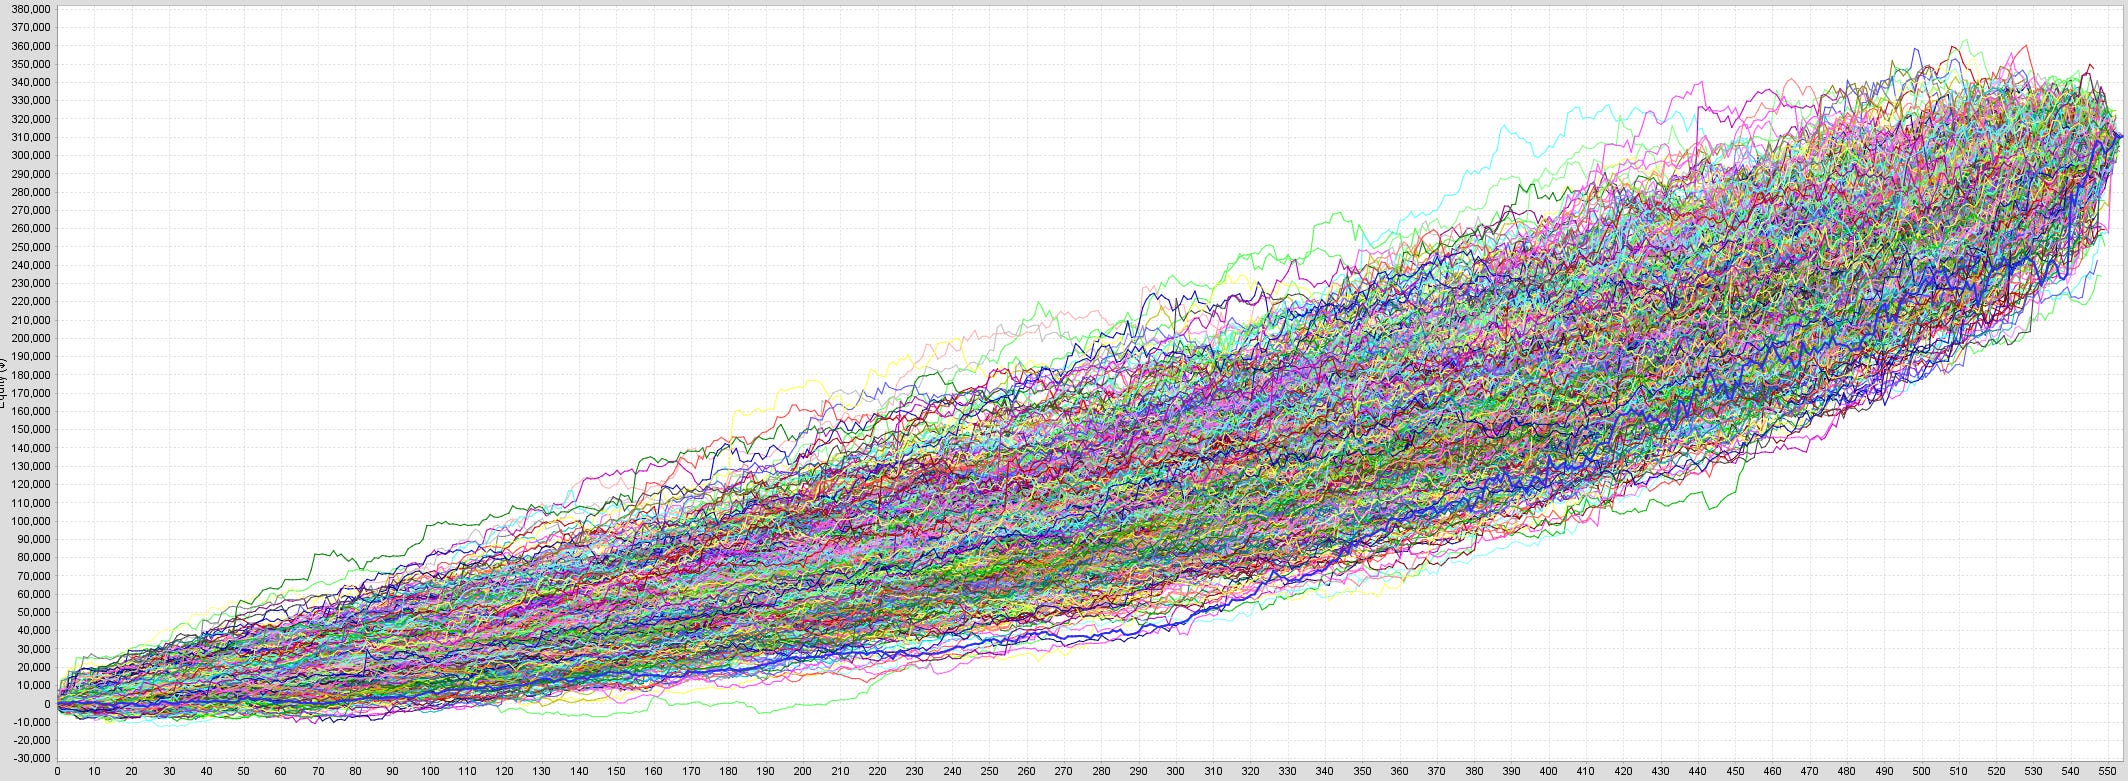
Monte Carlo randomise and skip trades
We shuffle the order of historical trades and randomly remove some to mimic misses, slippage, or bad fills. If performance stays healthy, the edge is not just luck in trade order.
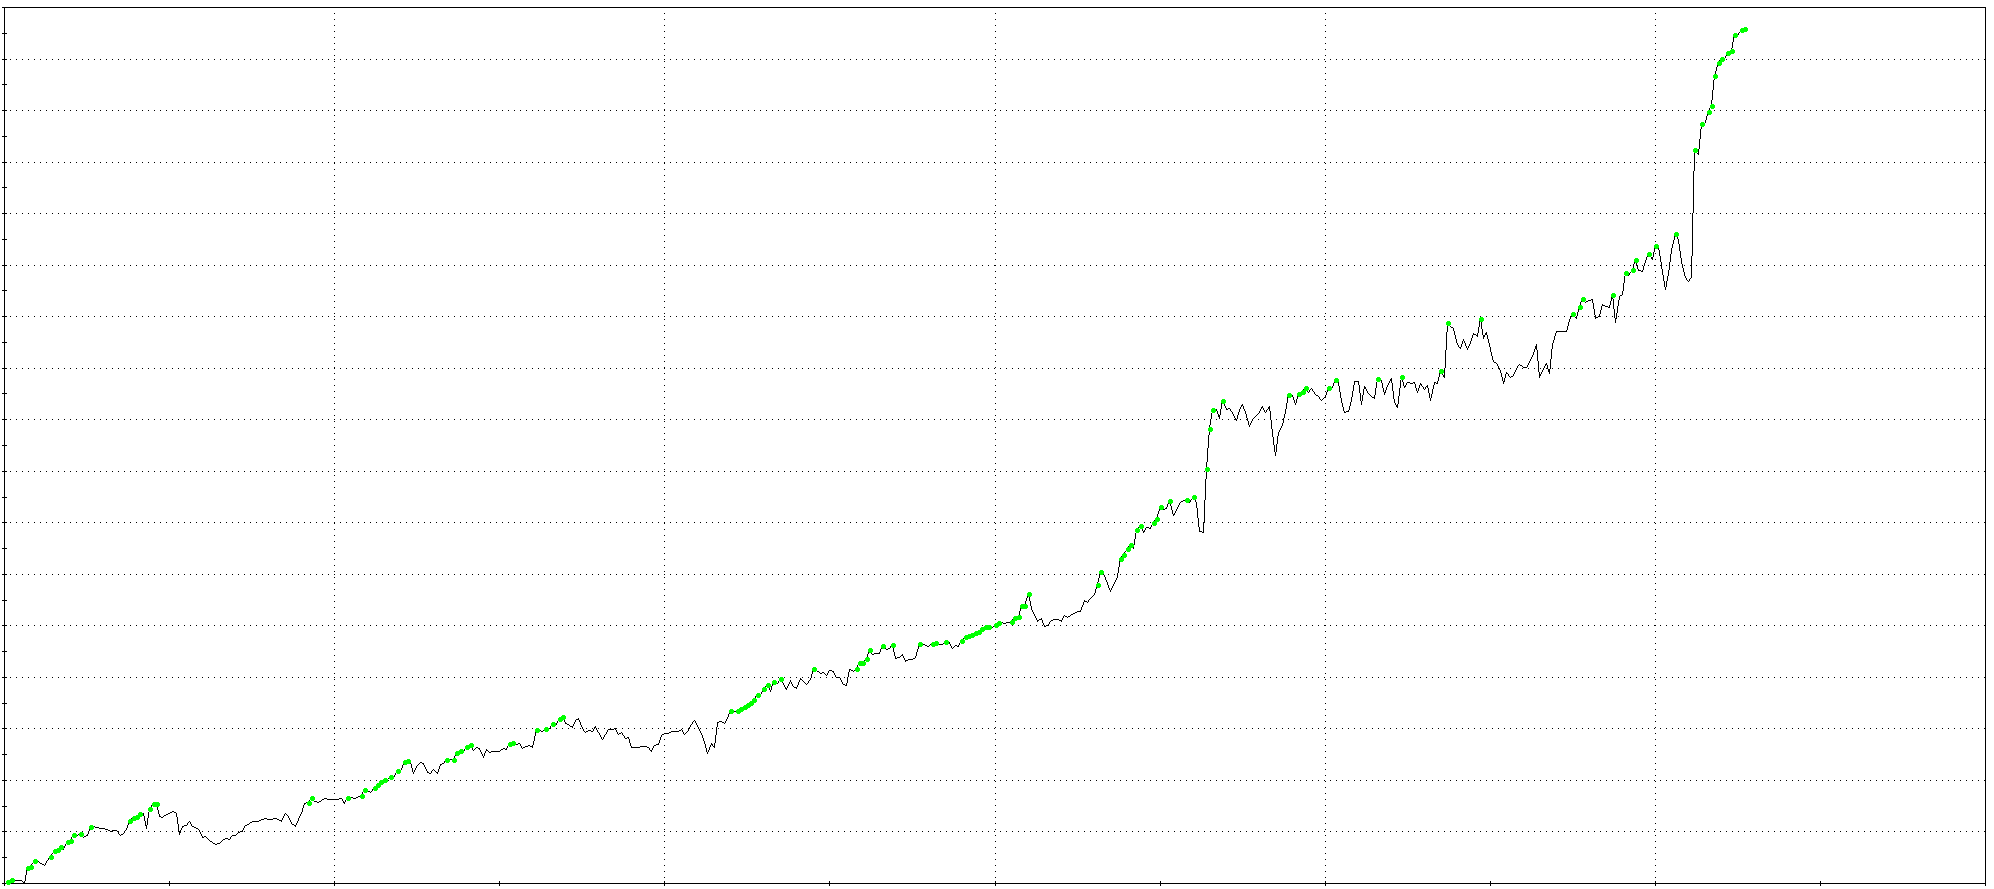
Extended out of sample results (Since 1999. This is the first time the model is seeing data before 2007. This run is a single pass with no touching.)
Extended out of sample equity (Since 1999. This is the first time the model is seeing data before 2007. This run is a single pass with no touching.)
Walk forward matrix
We split history into rolling windows, choose settings on one window, then run the next window out of sample. Consistent results across many windows mean the model adapts rather than being overfit on the data.
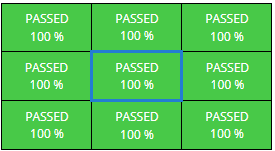
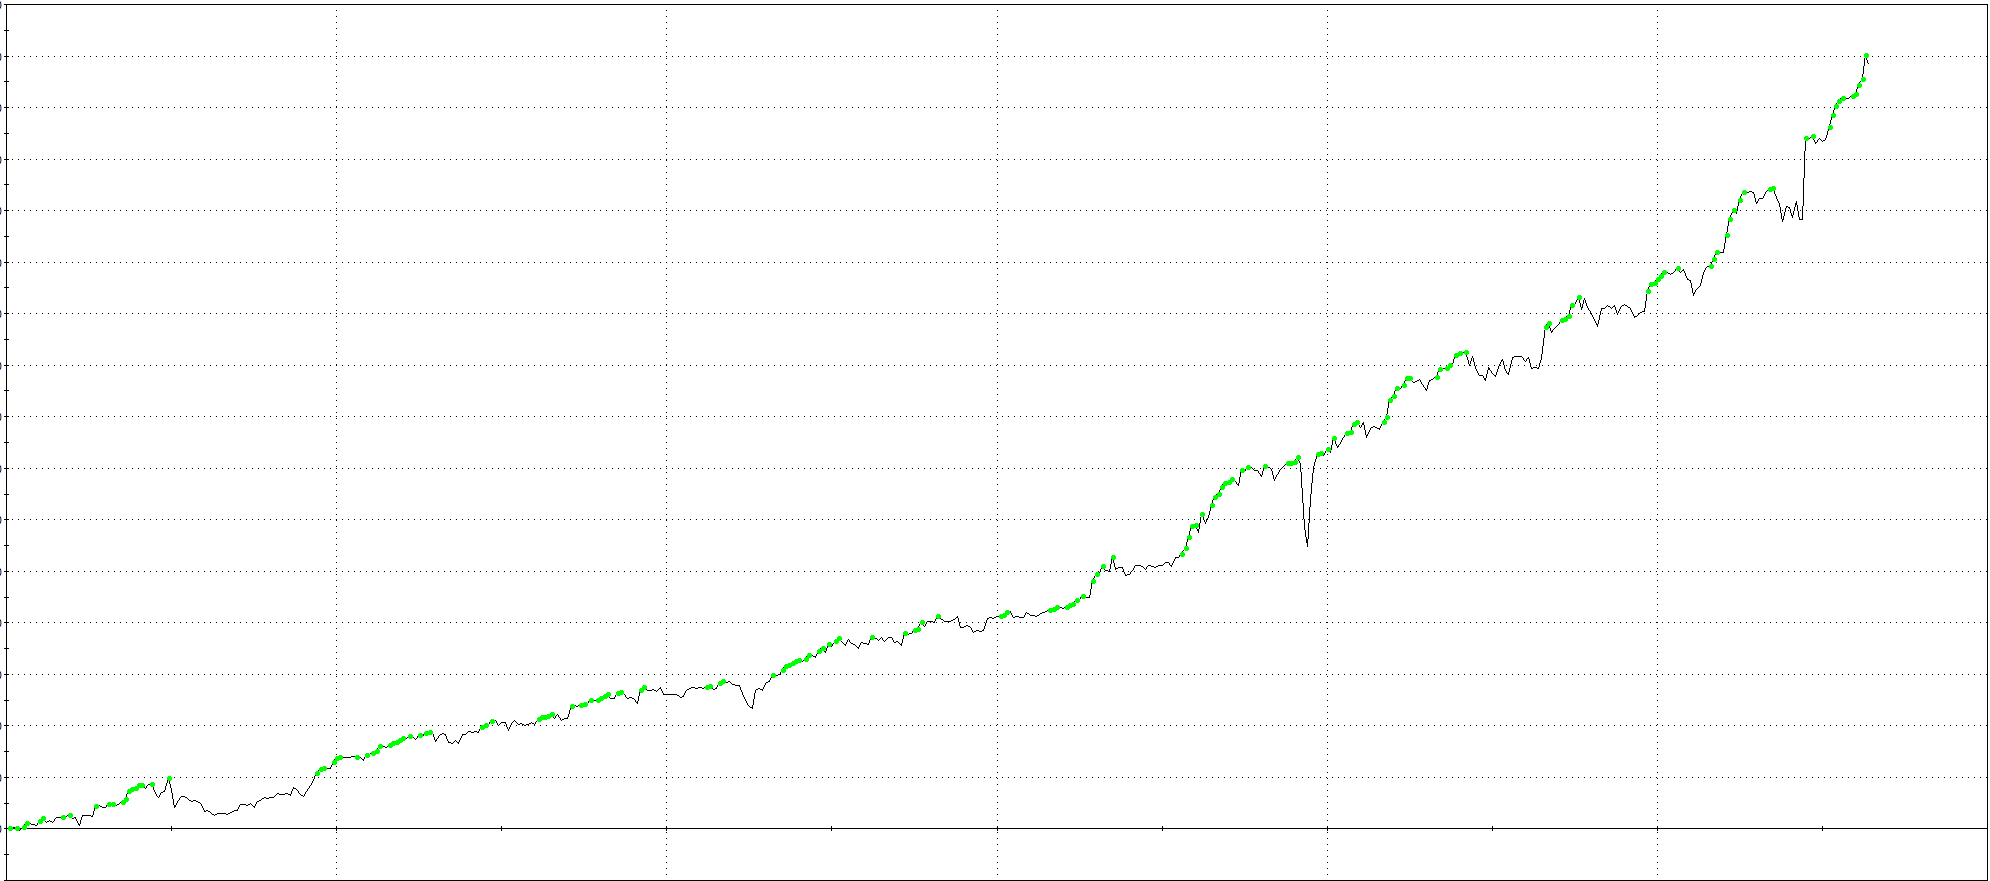
System parameter permutation test
We run many nearby parameter combinations around the chosen settings. If most versions work, the model is stable and not tuned to one narrow sweet spot. As you can see our net profit on the model is within the Median value which is a sign the model isnt lucky.
Results on alternative market (To check if robust or overfit) run on ES
We apply the same model on S&P 500 futures without adjusting the model (raw out of sample). If the results are acceptable, the idea is general and not tied only to NQ.
Results on alternative market (To check if robust or overfit) run on YM
We repeat the check on Dow futures without retuning. If it still holds up, that is further evidence the model is robust rather than overfit.
🛡️ MAE and the stop
Stops are for safety not prediction. I place the stop where normal noise ends and failure begins using the MAE picture. The wide distance keeps everyday swings from closing the trade. The two day time exit remains the main way out.
Ready to put it to work? The full EasyLanguage code is below.
Dont forget this code can be easily converted to any other trading platform using LLMs.
