Stop Trading in Chop. Start Using ADX.
A 1978 idea that kills chop and times your entries with strength.

💬 Message to Readers
Today I am telling the story of ADX. What it is, where it came from, why it helps, and five practical filters you can add to your playbook.
If you have followed my strategies, you know I am a fan of the ADX filter. Over years of building systems it has consistently proved itself as a robust tool worth using in your trading.
We will cover what ADX measures, how it is built, and why it cleans up trades by focusing on the times when the market is actually moving.
📖 The Problem
Most strategies do not fail because the core idea is bad. They fail because they keep trading when the market is choppy. You overtrade and the month’s P&L melts away.
In the late 1970s an engineer named J. Welles Wilder Jr. went looking for a universal way to tell how strong a move really was. Not which way, just how serious. The tool he created in his 1978 book New Concepts in Technical Trading Systems became the Average Directional Index, or ADX.
🛠️ What Is the ADX
ADX measures trend strength, not direction. It tells you how strong the move is, not whether it’s long or short.
Under the hood are two components, often plotted alongside ADX:
+DI (Positive Directional Indicator): Measures the strength of the upward push.
−DI (Negative Directional Indicator): Measures the strength of the downward push.
ADX blends the separation between these two and smooths it out.
High ADX The market is moving with sustained force (strong trend conditions).
Low ADX The market is locked in a range or plagued by fake outs.
How ADX Works Step by Step, In Simple Terms
Think of each bar as a tug of war for new territory.
Measure Today’s Push: We look at how much the price expanded up (above yesterday’s high) and how much it expanded down (below yesterday’s low). We only count the bigger move on that day.
Scale the Push: We divide the directional push by the day’s True Range (total volatility). This prevents big, choppy bars from unfairly dominating the calculation. This gives us the +DI and −DI streams.
Compare and Contrast: We measure the gap between the +DI and −DI streams. If they are far apart, a strong winner is emerging. If they are close, it’s a messy tug of war.
Smooth It Out: We apply Wilder’s averaging technique to this comparison number to prevent it from jumping around on every bar. That resulting smoothed value is the ADX.
✅ Why ADX Filters Help
The primary edge comes from what ADX prevents you from doing: trading noise.
Filters Out The Slow Hours: When ADX is low, noise dominates; most “signals” are random. Filtering these periods reduces whipsaws and protects your capital.
Improves Expectancy: Trading during higher strength windows tends to lift average win size and overall consistency of your system.
Travels Well: Because ADX is built from range expansion and not absolute price levels, it generalises across different symbols and timeframes.
Plays Nice With Exits: You can pair ADX with time exits or volatility stops to cut drawdowns without choking the core edge of your strategy.
💻 The Code: 5 Simple Filters
Here are five easy-to-test filters you can drop into your current strategy to immediately start weeding out poor trades.
How to Use the Code Snippet
Add
inputsandvariablesfrom the provided code snippet to your strategy.Paste the ADX calculation code before your entry logic.
Filter Trades: Change your entry condition from
if YourEntryCondition then Buy...toif YourEntryCondition and AllowTrade then Buy...
{ ========================================
  ADX TRADE FILTER
  5 Simple Filters - Code Snippet

  PURPOSE: Remove bad trades by filtering on trend strength


  SETUP REQUIRED:
  1. Add these inputs and variables to your strategy
  2. Paste the ADX calculation code BEFORE your entry logic
  3. Add “and AllowTrade” to your entry conditions

  Choose from 5 simple filters:
  Filter 0: OFF (no filtering)
  Filter 1: Basic ADX threshold (ADX > 25)
  Filter 2: ADX rising (trend strengthening)
  Filter 3: ADX moderate threshold (ADX > 20)
  Filter 4: ADX aggressive threshold (ADX > 30)
  Filter 5: ADX rising + threshold combo
  ======================================== }

// ============================================
// ADD THESE INPUTS TO YOUR STRATEGY
// ============================================
inputs:
	ADX_FilterType( 0 ),     // 0-5: Which filter to use (0 = OFF)
	ADX_Period( 14 );        // ADX calculation period

// ============================================
// ADD THESE VARIABLES TO YOUR STRATEGY
// ============================================
variables:
	AllowTrade(true),
	ADX(0),
	ADX_Prev(0),
	DIPlus(0),
	DIMinus(0),
	DX(0),
	TR(0),
	TR_Sum(0),       // Series variable - persists across bars
	DIPlus_Sum(0),   // Series variable - persists across bars
	DIMinus_Sum(0),  // Series variable - persists across bars
	i(0);

// ============================================
// PASTE THIS CODE BEFORE YOUR ENTRY LOGIC
// ============================================

// Calculate True Range
TR = MaxList(High - Low, AbsValue(High - Close[1]), AbsValue(Low - Close[1]));

// Calculate Directional Movement
Value1 = High - High[1];  // +DM
Value2 = Low[1] - Low;     // -DM

if Value1 > Value2 and Value1 > 0 then
	DIPlus = Value1
else
	DIPlus = 0;

if Value2 > Value1 and Value2 > 0 then
	DIMinus = Value2
else
	DIMinus = 0;

// Initialize sums on first bar or after enough bars
if CurrentBar = ADX_Period then begin
	TR_Sum = 0;
	DIPlus_Sum = 0;
	DIMinus_Sum = 0;

	for i = 0 to ADX_Period - 1 begin
		TR_Sum = TR_Sum + MaxList(High[i] - Low[i], AbsValue(High[i] - Close[i+1]), AbsValue(Low[i] - Close[i+1]));

		Value1 = High[i] - High[i+1];
		Value2 = Low[i+1] - Low[i];

		if Value1 > Value2 and Value1 > 0 then
			DIPlus_Sum = DIPlus_Sum + Value1;

		if Value2 > Value1 and Value2 > 0 then
			DIMinus_Sum = DIMinus_Sum + Value2;
	end;
end else if CurrentBar > ADX_Period then begin
	// Wilder’s smoothing
	TR_Sum = TR_Sum - (TR_Sum / ADX_Period) + TR;
	DIPlus_Sum = DIPlus_Sum - (DIPlus_Sum / ADX_Period) + DIPlus;
	DIMinus_Sum = DIMinus_Sum - (DIMinus_Sum / ADX_Period) + DIMinus;
end;

// Calculate +DI and -DI
if TR_Sum <> 0 then begin
	DIPlus = (DIPlus_Sum / TR_Sum) * 100;
	DIMinus = (DIMinus_Sum / TR_Sum) * 100;
end else begin
	DIPlus = 0;
	DIMinus = 0;
end;

// Calculate DX
if (DIPlus + DIMinus) <> 0 then
	DX = (AbsValue(DIPlus - DIMinus) / (DIPlus + DIMinus)) * 100
else
	DX = 0;

// Calculate ADX using Wilder’s smoothing
if CurrentBar = ADX_Period then begin
	ADX = Average(DX, ADX_Period);
end else if CurrentBar > ADX_Period then begin
	ADX = ((ADX[1] * (ADX_Period - 1)) + DX) / ADX_Period;
end;

ADX_Prev = ADX[1];

// Default: Allow all trades
AllowTrade = true;

// Apply selected filter
if ADX_FilterType = 0 then begin
	AllowTrade = true;  // Filter OFF
end;

if ADX_FilterType = 1 then begin  // Basic threshold
	AllowTrade = ADX > 25;
end;

if ADX_FilterType = 2 then begin  // ADX rising
	AllowTrade = ADX > ADX_Prev;
end;

if ADX_FilterType = 3 then begin  // Moderate threshold
	AllowTrade = ADX > 20;
end;

if ADX_FilterType = 4 then begin  // Aggressive threshold
	AllowTrade = ADX > 30;
end;

if ADX_FilterType = 5 then begin  // Rising + threshold combo
	AllowTrade = ADX > 20 and ADX > ADX_Prev;
end;

// ============================================
// ADD TO YOUR ENTRY CONDITIONS
// ============================================
// Modify your entry logic like this:
//
// OLD: if YourEntryCondition then Buy...
// NEW: if YourEntryCondition and AllowTrade then Buy...
//
// Examples:
// if Close > Average(Close, 20) and AllowTrade then
//     Buy next bar at market;
//
// if LongSignal and AllowTrade then
//     Buy next bar at market;
📈 Results
I will run this filter on a very simple 20-day breakout model on NQ on 240 min bars .
Baseline (no filter)
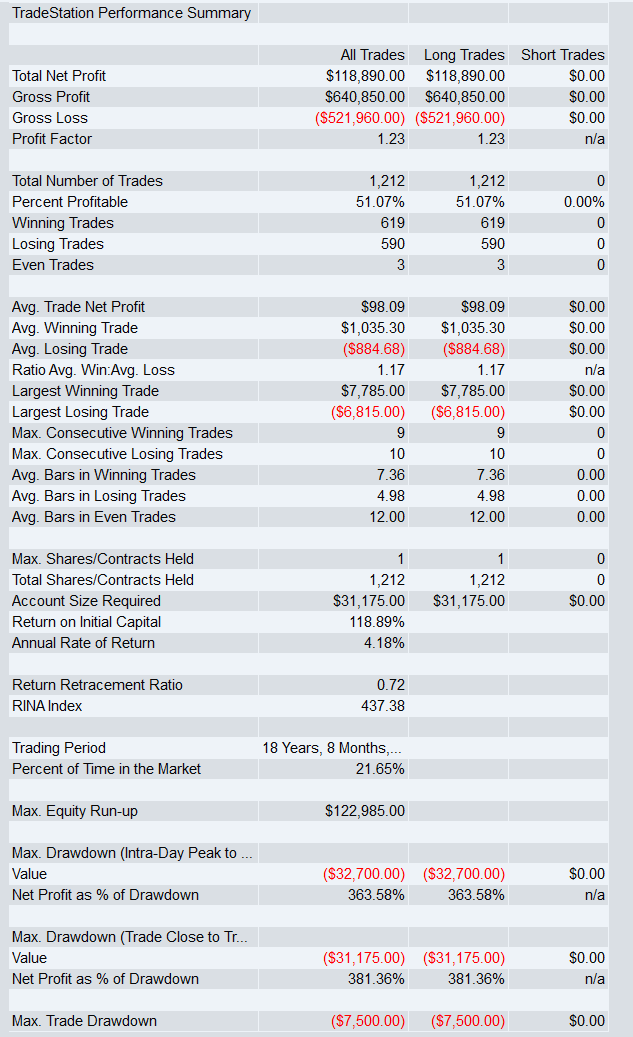
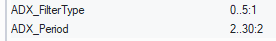
Optimising settings:
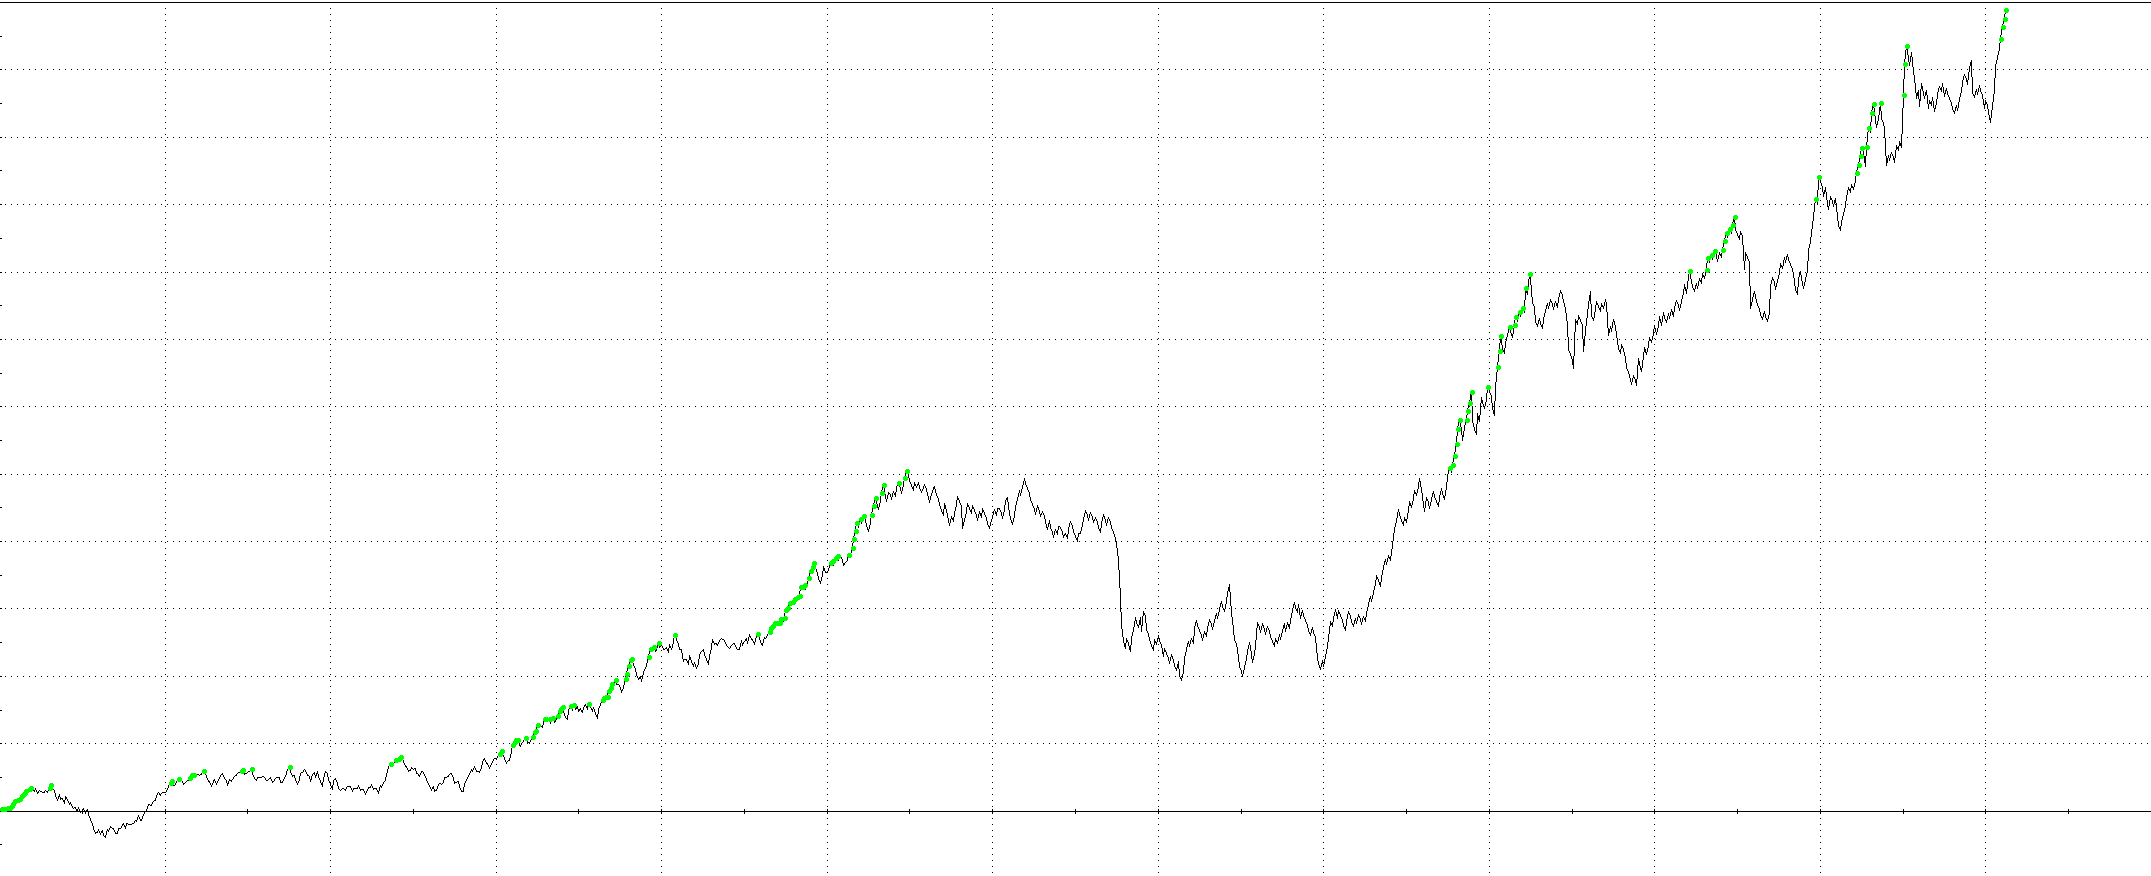
After ADX filter:
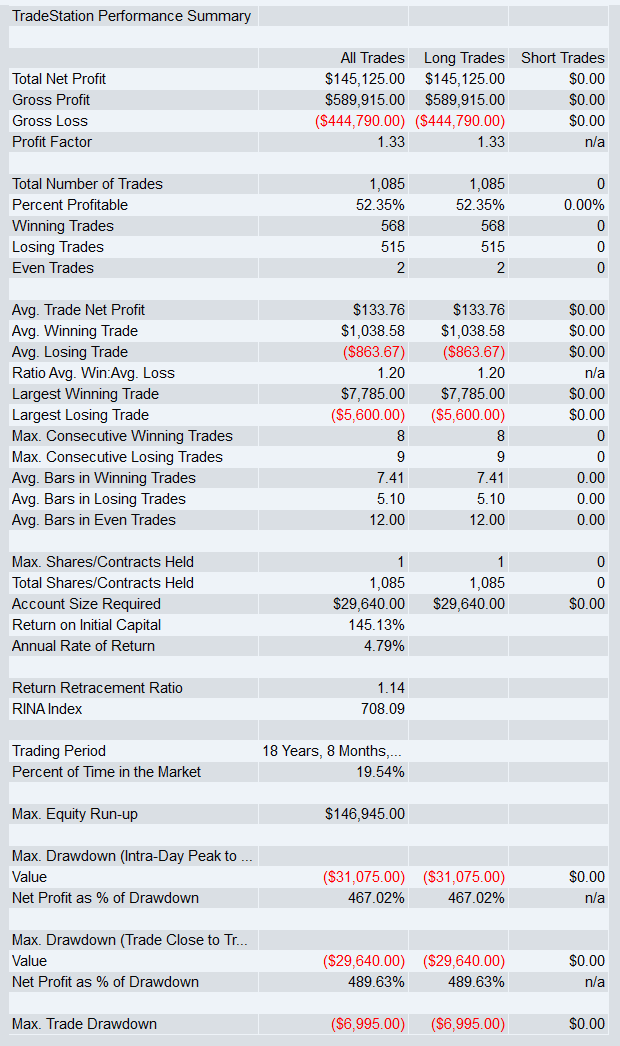
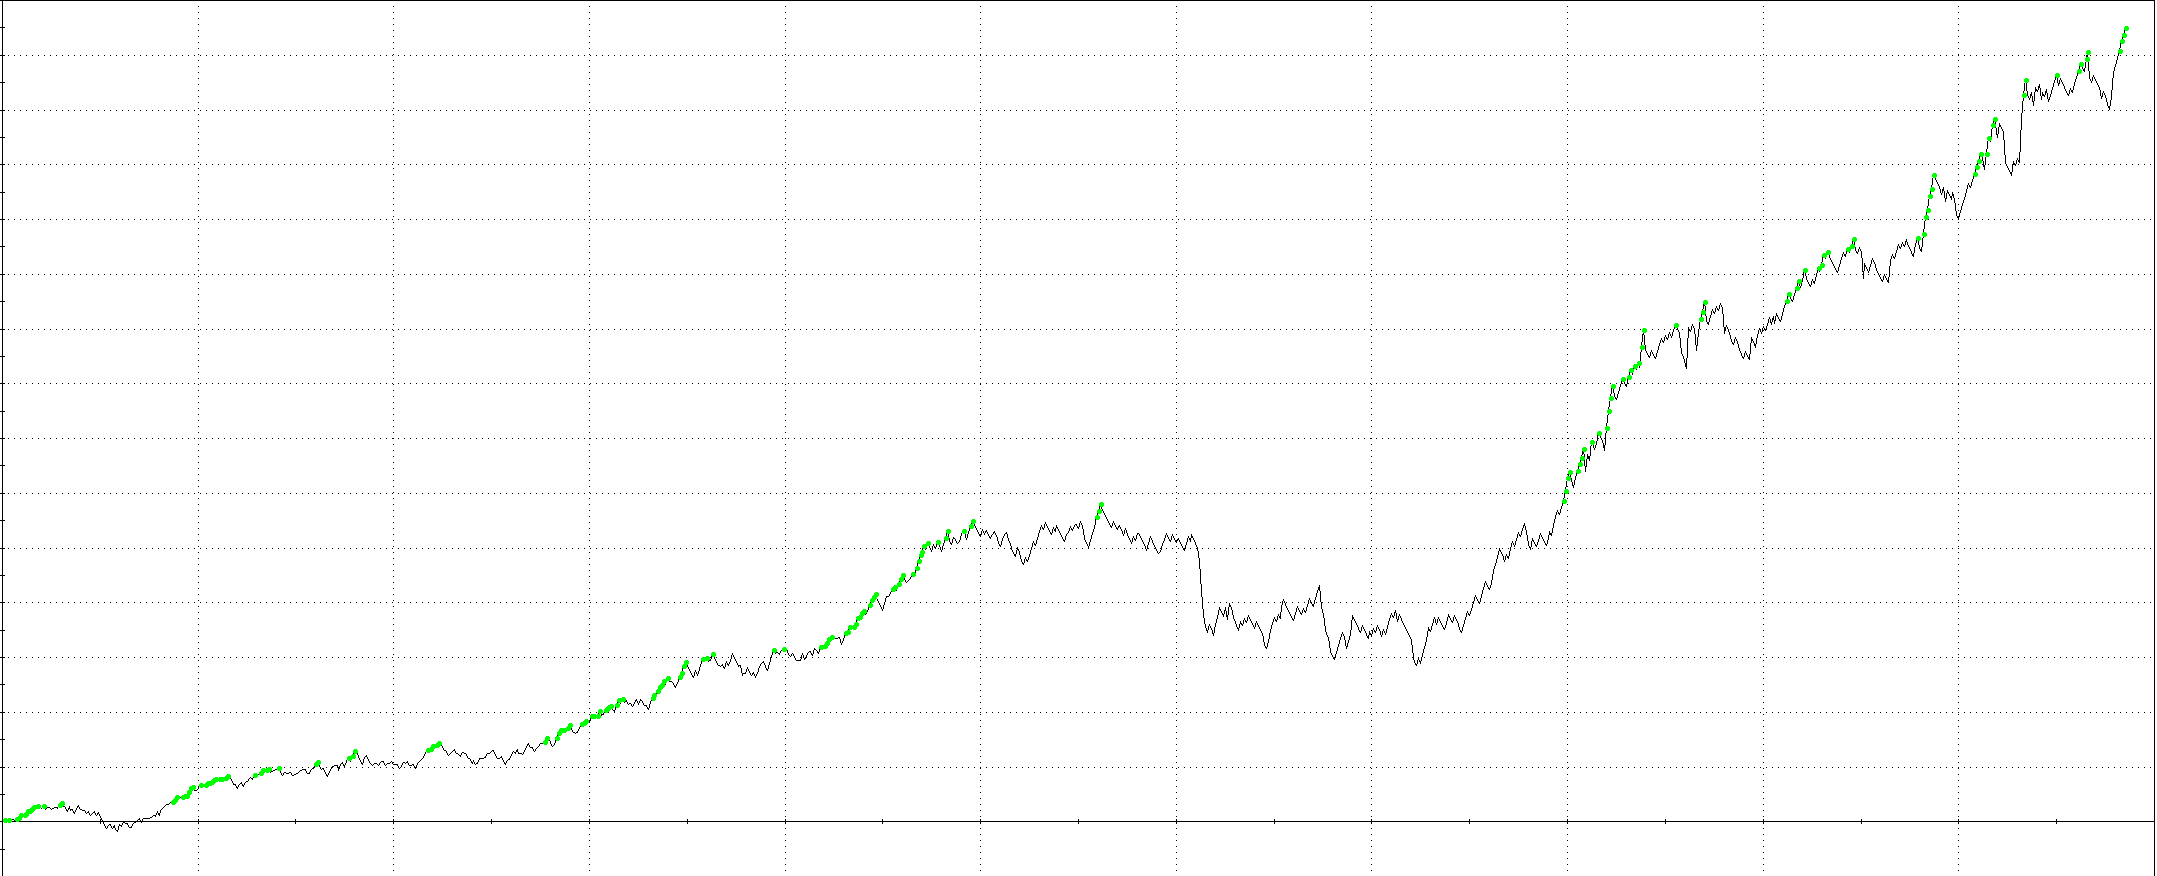
We were able to improve the baseline strategy by 28 percent simply by removing noise from our trading.
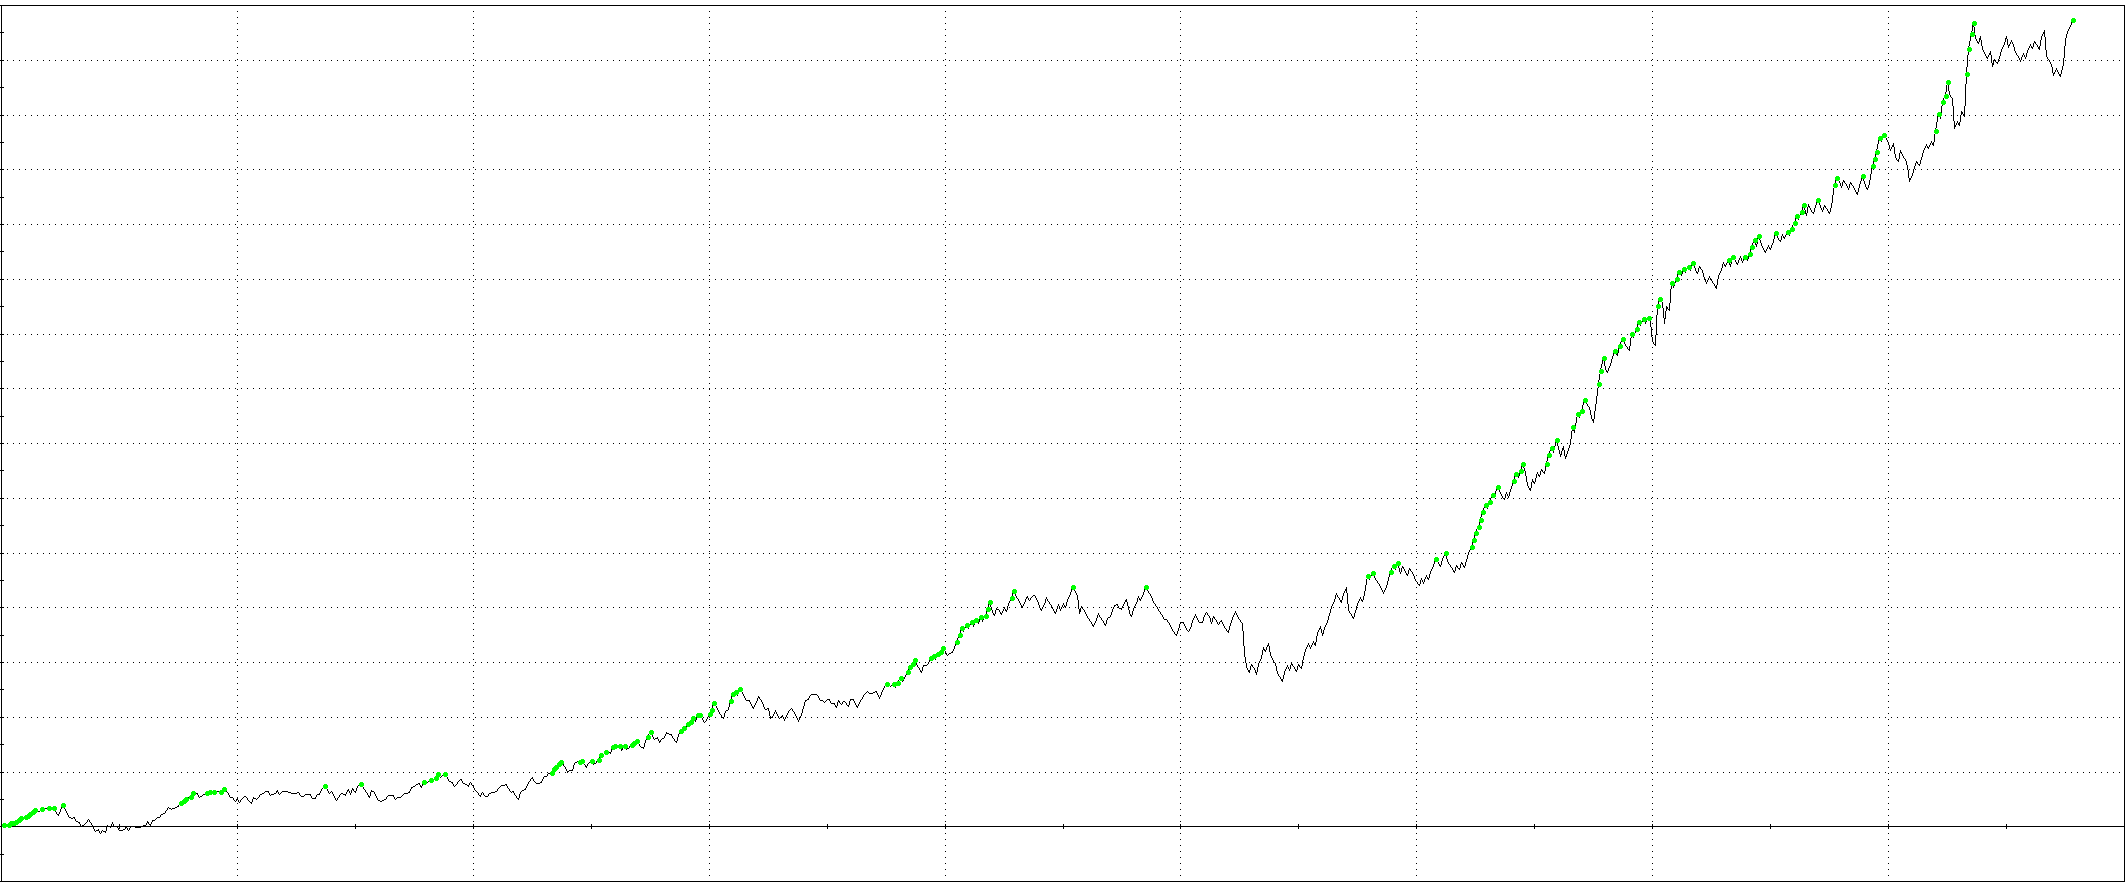
Advanced: The 20-Filter Grid
Once you have seen the lift from the basic filters you will be ready for the full ADX module. This section details 20 trade filters I use when building strategies. Each has shown robust behaviour in its own way. As with the basic set you can optimise across filters, since different strategies work better with different filters.
With the implementation of this block of filters we improved the baseline strategy by 122.32 percent return on risk. That is not a typo.
Alright, enough chat—let’s get into it.