This Simple 1994 Strategy Still Wins 66% of the Time
One trend filter cut drawdown by 64%, lifted profit factor to 2.41, and paired with Turnaround Tuesday at negative 0.06 correlation.

One old indicator.
One simple improvement.
Nearly three decades of ES data.
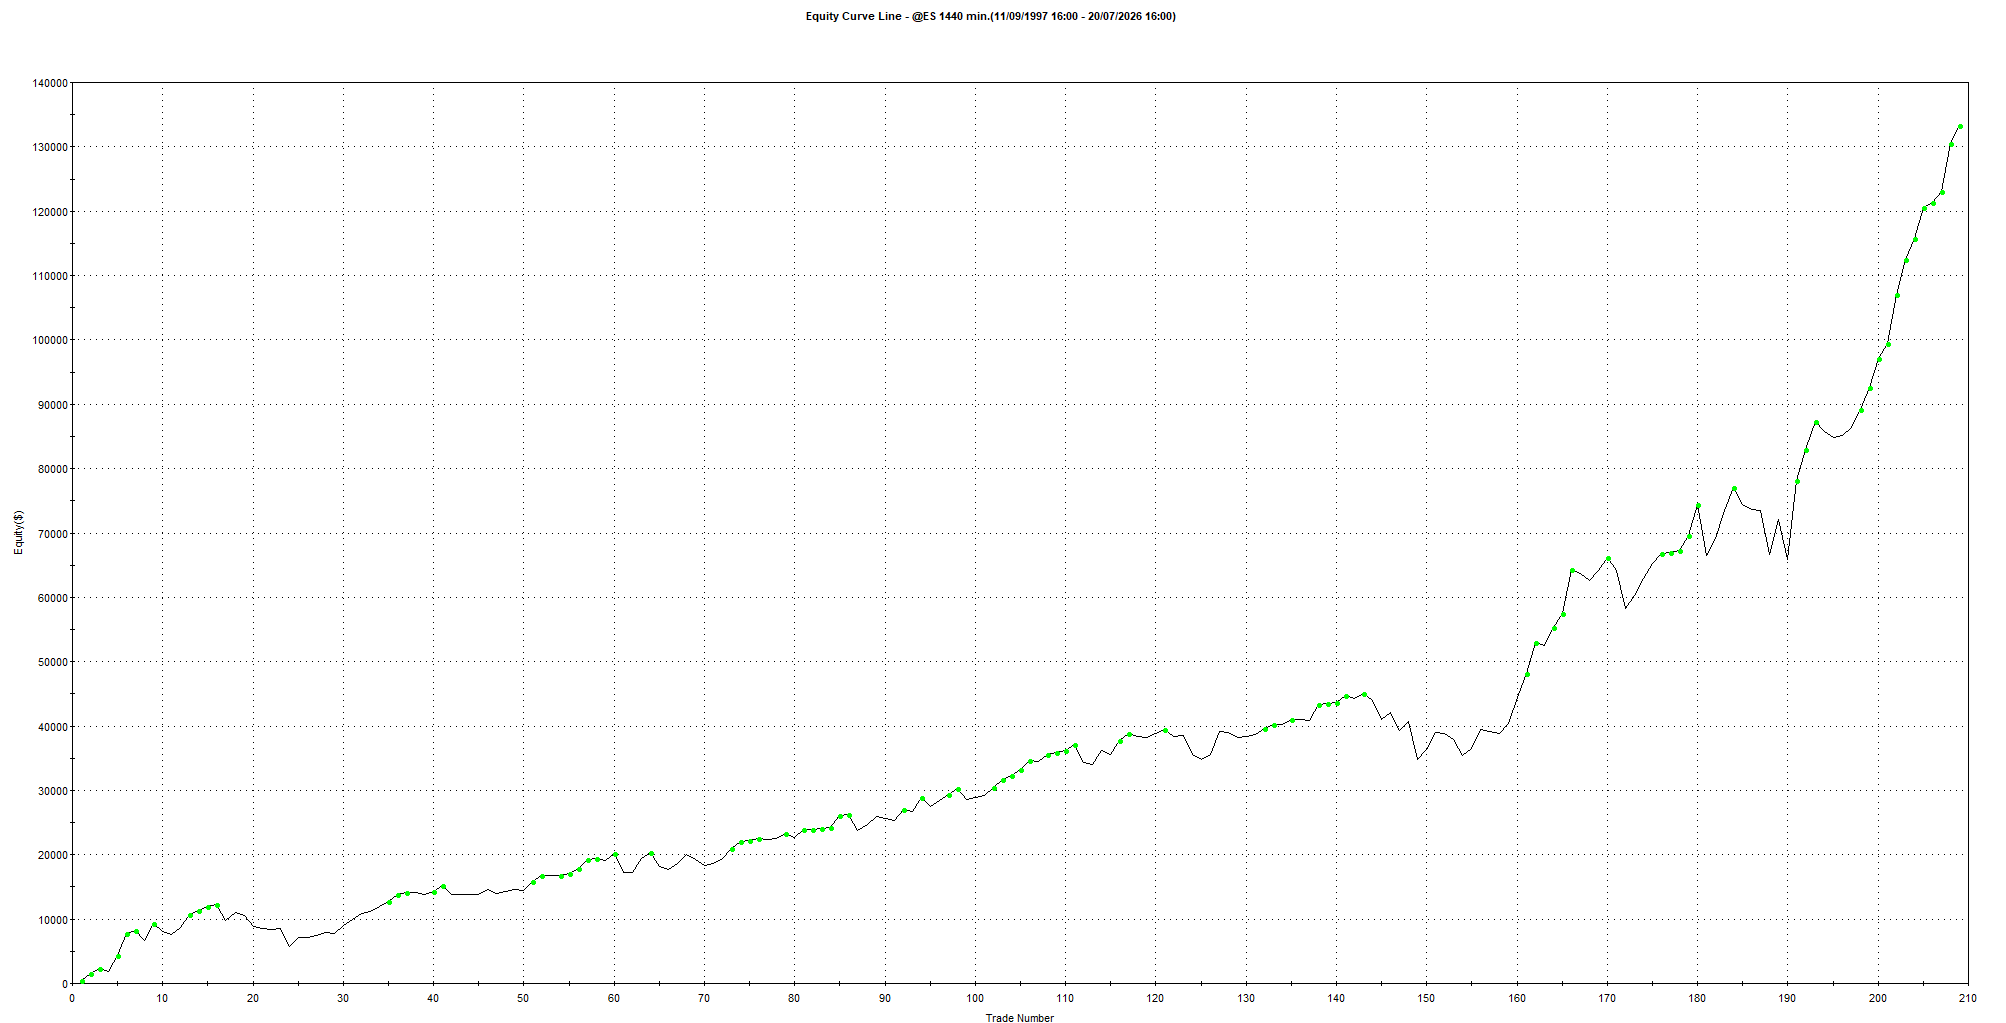
The final model produced:
$133,250 net profit
66.51% winning trades
2.41 profit factor
$637.56 average trade
$11,162.50 maximum drawdown
11.94 Return to Drawdown
Here is the equity curve.
The interesting part is not the indicator itself.
It is the market behaviour behind it.
This model steps in after heavy short-term selling and waits for price to recover. In economic terms, it appears to harvest a mix of the long-term equity premium and the short-term compensation available to traders willing to absorb temporary selling pressure.
It is not a guaranteed return.
It gets paid because buying into weakness can be uncomfortable and sometimes extremely painful.

Is This a Risk Premium Strategy?
Not in the same way as a traditional academic factor such as value or momentum.
A better description is:
A tactical risk-premium harvesting strategy.
The model only trades long, so it benefits from the long-term upward bias of equity markets.
But it is not permanently invested.
It waits until short-term downside momentum becomes unusually strong, then takes the other side of the selling.
That is similar to providing liquidity.
Markets do not fall only because investors suddenly agree that fair value is lower.
Selling can also come from:
Portfolio hedging
Fund redemptions
Margin pressure
Volatility targeting
Risk limits
Forced deleveraging
Panic
These flows can temporarily push price away from its short-term balance.
Someone has to absorb those orders.
The potential rebound is the compensation for accepting the risk that the decline continues.
That is the economic reason this type of edge can persist.
The CMO is simply how we identify the condition.
Why This Edge Can Keep Working
The strategy is not relying on traders being unaware of an indicator from 1994.
The behaviour existed long before the CMO was created.
People panic.
Funds reduce exposure.
Leverage gets cut.
Institutional constraints force trades that may have little to do with long-term value.
Those pressures are unlikely to disappear.
But the edge is not free.
An oversold market can become more oversold.
A correction can become a crash.
A temporary drawdown can last for years.
That is why the original strategy needed improvement.
The Original CMO Model
The Chande Momentum Oscillator was introduced by Tushar Chande and Stanley Kroll in The New Technical Trader in 1994.
Our ES test begins in 1997.
That means the full backtest occurred after the indicator and its framework were already public.
The model had to survive:
The dot-com crash
The 2008 financial crisis
The long post-crisis bull market
The COVID crash
The 2022 decline
The markets that followed
The rules came first.
The data came later.
Original results
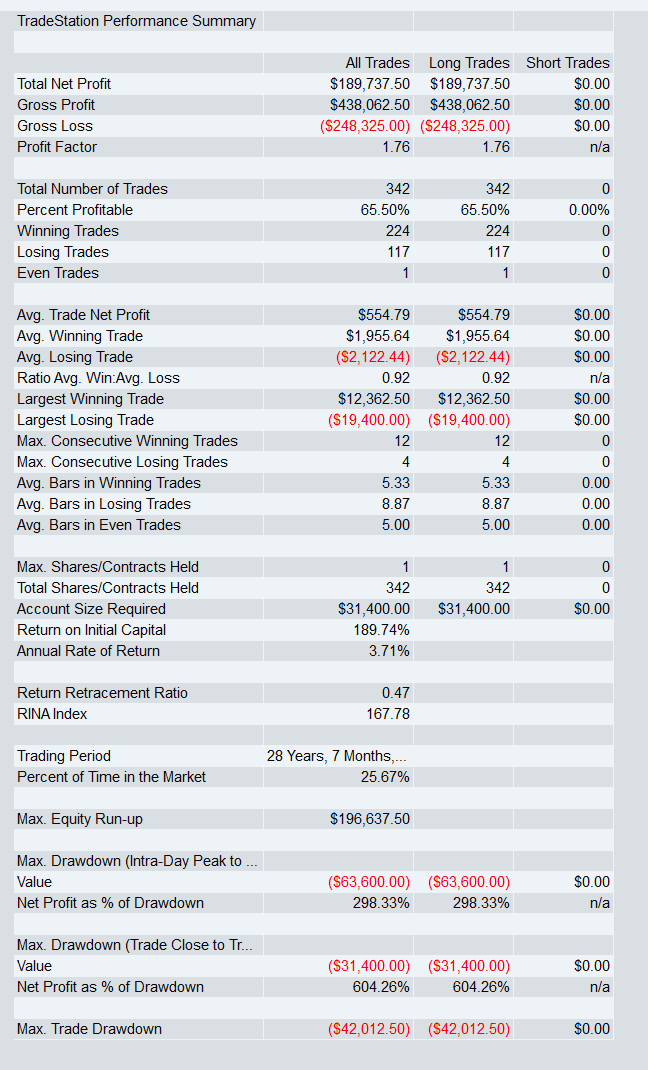
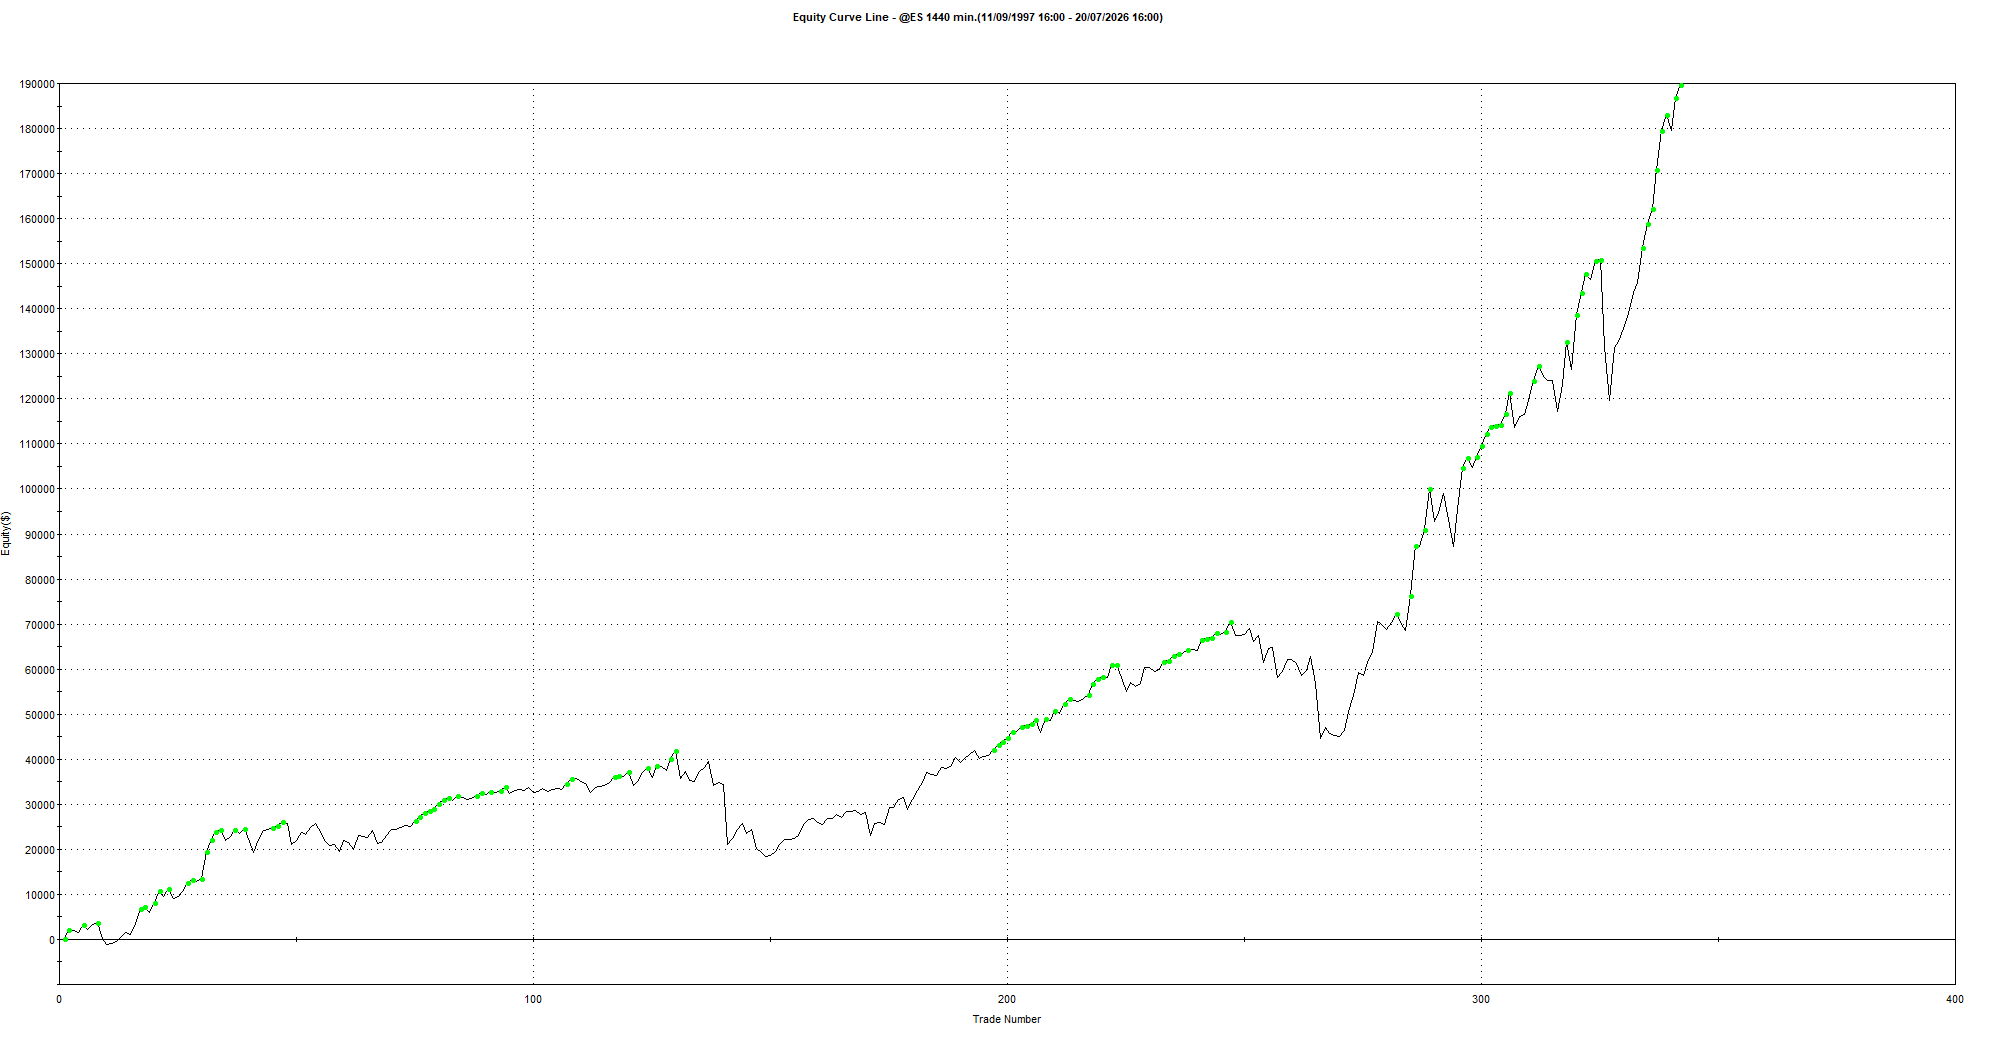
The raw result is profitable.
But the risk profile is difficult.
The maximum drawdown reached $31,400.
The largest losing trade was $19,400.
The model also spent more than a quarter of the test period in the market.
This is the main weakness of unfiltered dip buying.
A market can look oversold while the larger trend remains deeply hostile.
The short-term signal may eventually recover, but the damage on the way can be severe.
Our Improvement
We did not rebuild the strategy.
We did not add a stack of indicators.
We added one broad regime filter.
The purpose was simple:
Only buy short-term weakness when the larger market trend still supports long exposure.
That removed a meaningful number of trades.
It also reduced total profit.
But the quality of the remaining trades improved sharply.
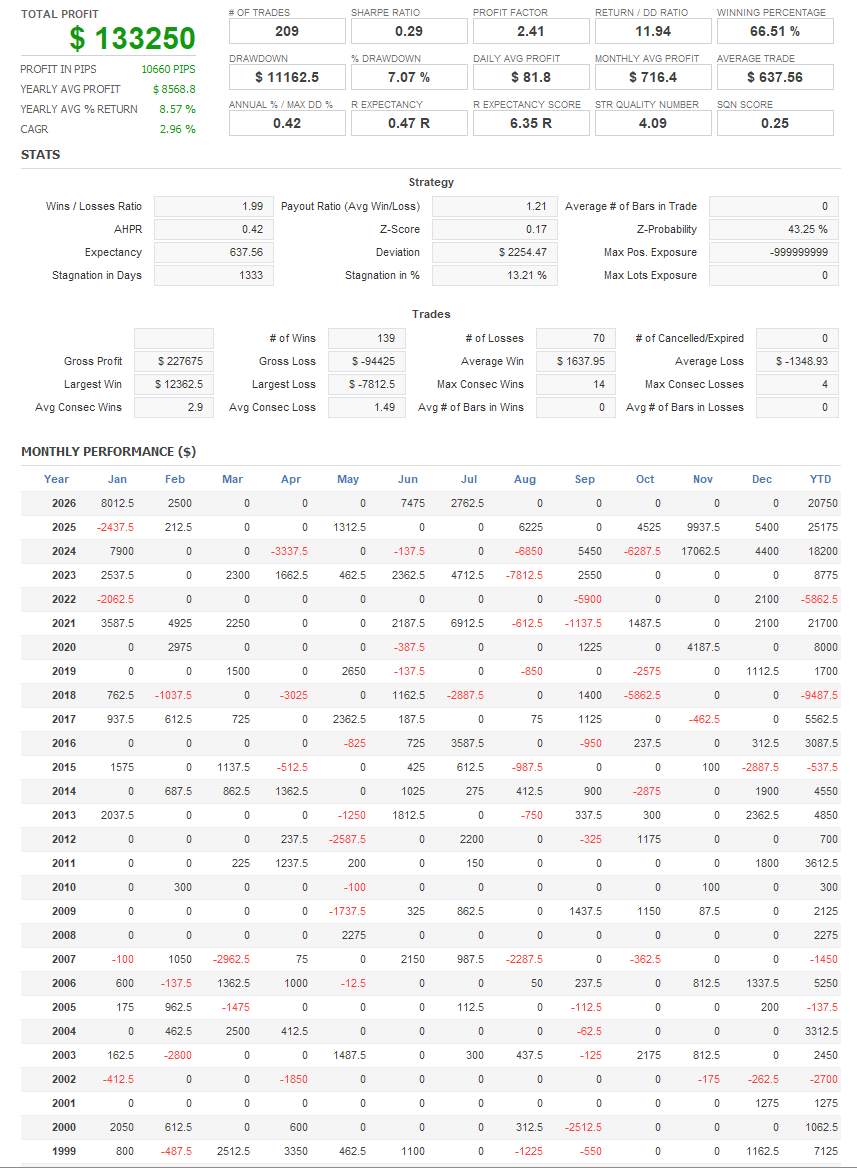
We gave up around 30% of the historical net profit.
In exchange:
Drawdown fell by 64%
The largest loss fell by 60%
Profit factor increased to 2.41
Average trade improved
Market exposure almost halved
Return to Drawdown nearly doubled
That is a trade we are willing to make.
The goal was not to maximise the backtest profit.
The goal was to produce a strategy we would have a better chance of sticking with through a difficult period.
Why Return to Drawdown Matters
Looking only at net profit makes the original strategy appear better.
It earned around $56,000 more.
But it required nearly three times the maximum drawdown.
The original strategy produced approximately:
$6.04 in total profit for every $1 of maximum drawdown.
The filtered version produced:
$11.94 in total profit for every $1 of maximum drawdown.
That is almost double the risk efficiency.
We can increase exposure later through portfolio construction or position sizing.
It is much harder to repair an unstable underlying return stream.
Adding It to Turnaround Tuesday
A strong standalone backtest is useful.
But we are more interested in what a strategy adds to the wider portfolio.
We combined the filtered CMO model with our previously released Turnaround Tuesday strategy.
For anyone who missed it, Turnaround Tuesday is another short-term ES mean-reversion model. It focuses on weakness early in the week and exits quickly.
At first glance, the two strategies sound almost identical.
Both trade ES.
Both are long only.
Both buy weakness.
But their weekly return correlation was: -0.06
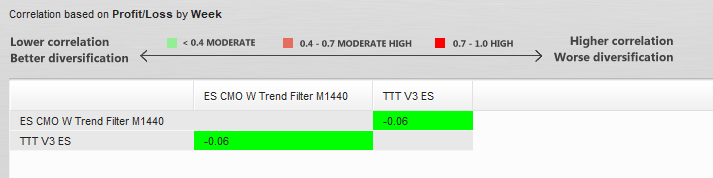
That is close to zero.
The CMO strategy trades broad short-term selling pressure.
Turnaround Tuesday focuses on a specific recurring weekly window.
One is driven by price becoming stretched.
The other is driven by market timing and weekday behaviour.
Different logic produced different trades.
Different trades produced different periods of strength and weakness.
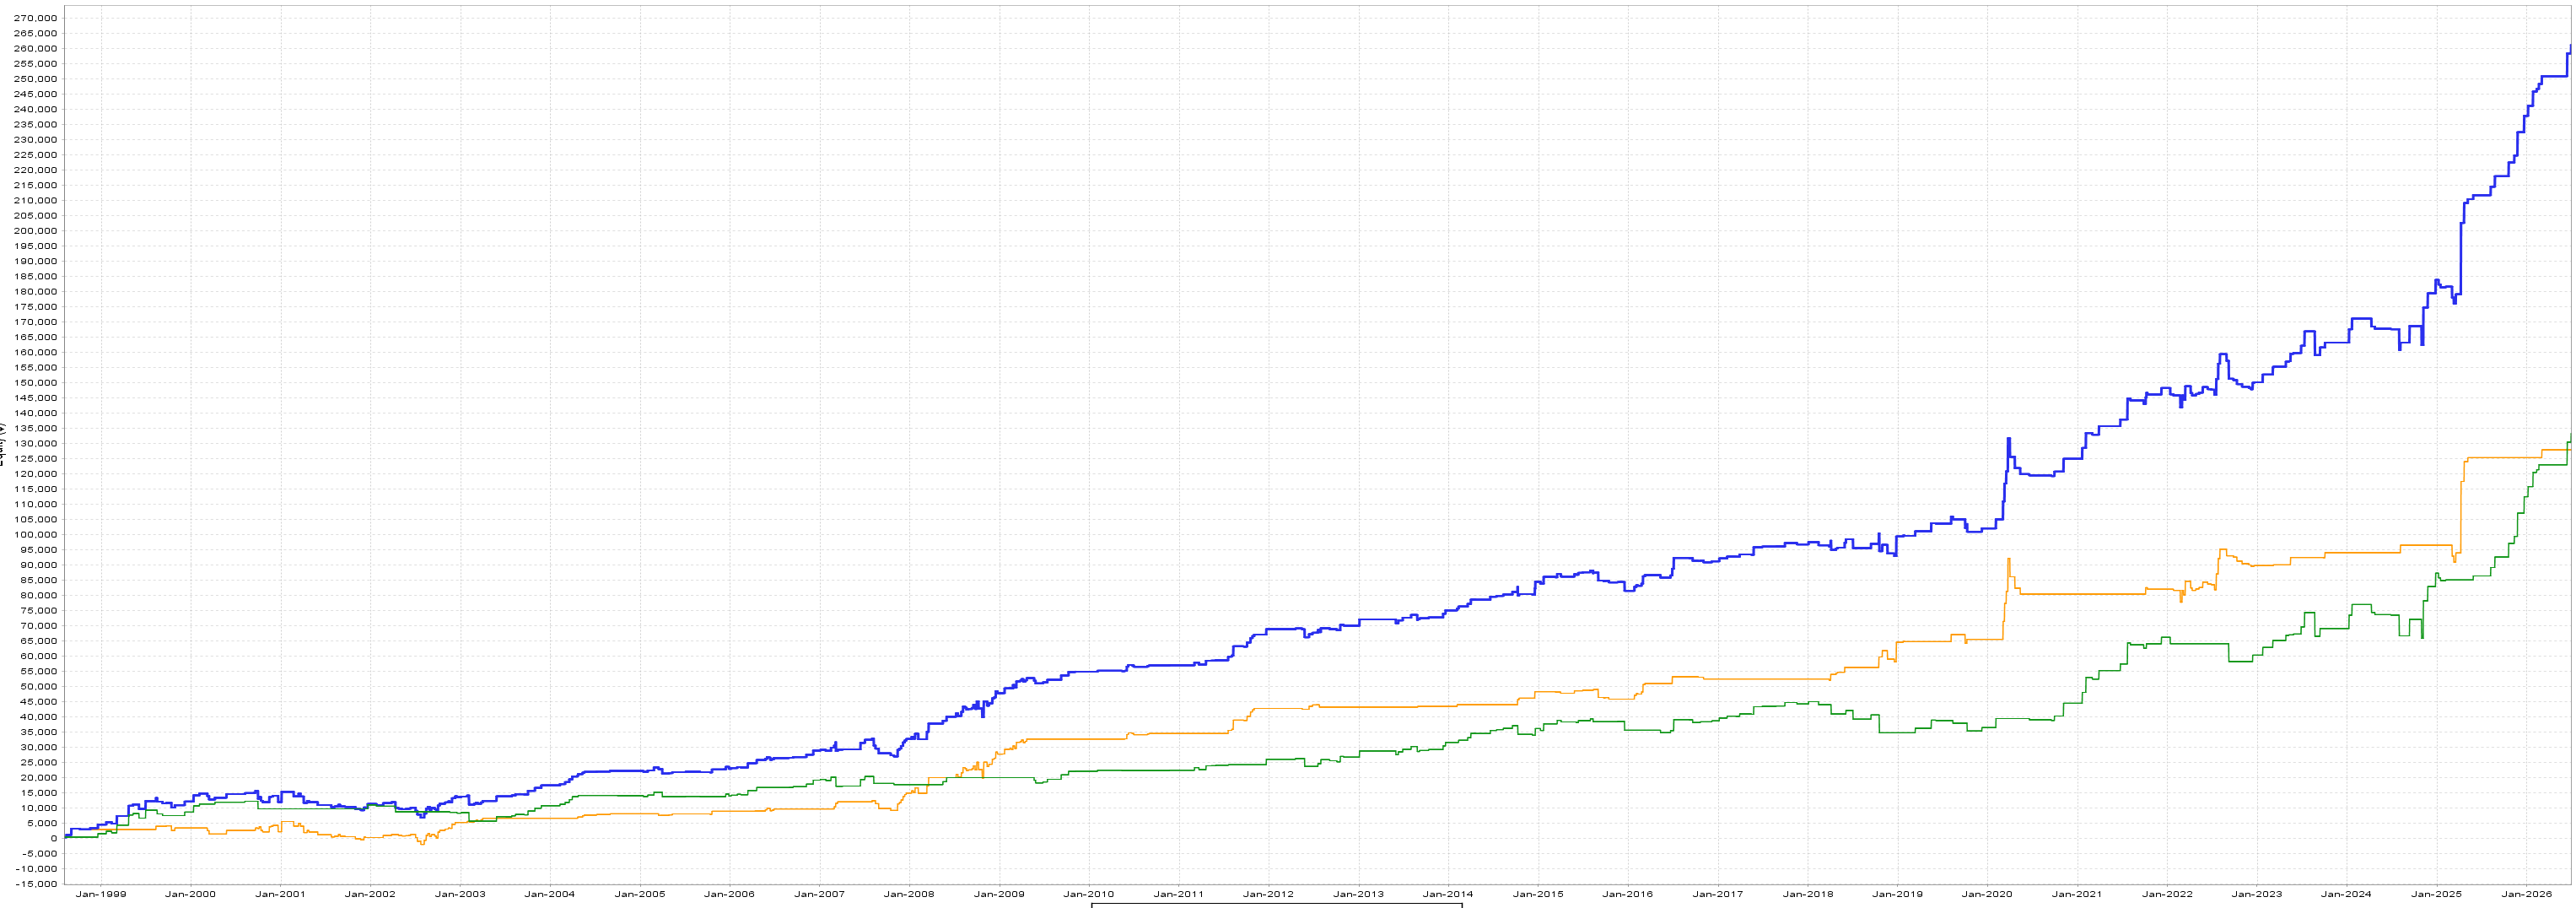
The blue line is the combined portfolio.
The orange and green lines are the individual strategies.
The combined equity moved beyond $250,000 because one model could contribute while the other was quiet or struggling.
This is another example of why diversification should be measured using strategy returns.
Two models can trade the same market in the same direction and still work well together when they define the opportunity differently.
For the full Turnaround Tuesday research, results and code, read:
Turnaround Tuesday: The One-Day Edge That Still Works
The Real Lesson
The CMO is not the edge by itself.
The edge is the behaviour it identifies.
Short-term selling can become excessive.
Traders willing to absorb that pressure may earn a premium when price normalises.
But the original model showed the cost clearly:
Large drawdowns
Large individual losses
Exposure during hostile regimes
Long stagnation periods
The trend filter did not create a new edge.
It improved where we chose to harvest the existing one.
The filtered model produced less total profit but delivered:
A stronger profit factor
A larger average trade
Far lower drawdown
Less market exposure
Nearly twice the Return to Drawdown
It also combined with Turnaround Tuesday at negative 0.06 weekly correlation.
That makes the model valuable as more than a standalone strategy.
Ready to See the Exact Rules?
You have seen the logic, the results, the drawdown improvement and how it fits alongside Turnaround Tuesday.
Next, we break down the exact CMO settings, the trend filter and the full TradeStation code so you can reproduce the test yourself.