This Simple Mean Reversion Strategy Has Stood the Test of Time
Larry Connors’ classic RSI(2) strategy has survived more than 17 years out of sample — and of course, we had to add our own twist.

Most traders do not need another complicated strategy.
You do not need six indicators.
You do not need more optimisation.
And you definitely do not need another system that looks incredible until it meets real markets.
What you need is something much harder to find:
A simple edge that still behaves like an edge after everyone already knows about it.
That is why Larry Connors’ RSI(2) strategy still matters.
Not because it is flashy.
Not because it is new.
But because it solves a real problem:
How do you buy weakness in an uptrend without turning every dip into a disaster?
That is where this setup earns its reputation.
It is simple.
It is public.
And it gives you a strong baseline to build from.

Why this strategy still matters
Larry Connors did not invent RSI.
J. Welles Wilder created RSI.
What Connors did was turn it into one of the best-known short-term mean reversion frameworks traders still use today:
buy short-term weakness
only do it in the right broader trend
exit on the snapback
That is why RSI(2) is still worth studying.
Not because it is complex.
Because it is robust.
It is built on a behaviour that still exists:
markets trend
pullbacks happen fast
fear overshoots
price snaps back toward the mean
The indicator is not the edge.
The behaviour is the edge.
Connors original RSI(2) strategy
The original logic is simple:
long when price is above the 200-day moving average and RSI(2) is oversold
short when price is below the 200-day moving average and RSI(2) is overbought
exit longs when price closes above the 5-day moving average
exit shorts when price closes below the 5-day moving average
That is it.
No fancy regime model.
No stack of filters.
No curve fit complexity.
And importantly, Connors’ original rules did not use a stop.
To stay true to the original research, that is how I tested the baseline.
That said, I have added an optional fixed-dollar stop feature to the code. So if you are not comfortable trading without a stop, you can enable it and define your own dollar risk per contract.
I also used 255 reserved bars in testing so all calculations had enough history to initialise properly.
{ ==============================================================
LARRY CONNORS RSI2 STRATEGY - EasyLanguage for TradeStation
TradeDirection Input:
1 = Long Only
2 = Short Only
3 = Both Long and Short
Original Rules:
Trend Filter : Price vs 200-bar SMA
Long Entry : Close > 200 SMA AND RSI(2) < OversoldLevel
Short Entry : Close < 200 SMA AND RSI(2) > OverboughtLevel
Long Exit : Close > 5-bar SMA
Short Exit : Close < 5-bar SMA
Stops : Optional - Connors used none
Stop is a fixed dollar amount per contract.
e.g. StopAmt = 1000 means stop is $1000 from entry.
Set UseStop = False to match Connors original rules.
============================================================== }
{ ── Inputs ───────────────────────────────────────────────── }
Input: RSI_Period (2);
Input: OversoldLevel (10);
Input: OverboughtLevel (90);
Input: TrendMA_Period (200);
Input: ExitMA_Period (5);
Input: TradeDirection (3); { 1=Long Only, 2=Short Only, 3=Both }
Input: UseStop (False); { Keep False to match Connors original }
Input: StopAmt (1000); { Fixed dollar stop per contract }
{ ── Vars ─────────────────────────────────────────────────── }
Var: MyRSI (0);
Var: TrendMA (0);
Var: ExitMA (0);
Var: AllowLong (0);
Var: AllowShort (0);
{ ── Calculations ────────────────────────────────────────── }
MyRSI = RSI(Close, RSI_Period);
TrendMA = Average(Close, TrendMA_Period);
ExitMA = Average(Close, ExitMA_Period);
{ ── Trade Direction ─────────────────────────────────────── }
AllowLong = 0;
AllowShort = 0;
If TradeDirection = 1 Or TradeDirection = 3 Then AllowLong = 1;
If TradeDirection = 2 Or TradeDirection = 3 Then AllowShort = 1;
{ ── Long Entry ──────────────────────────────────────────── }
If AllowLong = 1
And Close > TrendMA
And MyRSI < OversoldLevel
And MarketPosition <= 0 Then
Buy("RSI2 Long") Next Bar at Market;
{ ── Long Exit ───────────────────────────────────────────── }
If MarketPosition = 1
And Close > ExitMA Then
Sell("Exit Long") Next Bar at Market;
{ ── Short Entry ─────────────────────────────────────────── }
If AllowShort = 1
And Close < TrendMA
And MyRSI > OverboughtLevel
And MarketPosition >= 0 Then
SellShort("RSI2 Short") Next Bar at Market;
{ ── Short Exit ──────────────────────────────────────────── }
If MarketPosition = -1
And Close < ExitMA Then
BuyToCover("Exit Short") Next Bar at Market;
{ ── Fixed Dollar Stop (Optional) ────────────────────────── }
{ Connors used no stops - set UseStop = False to match original }
{ SetStopLoss monitors intrabar and takes dollar amount directly }
If UseStop Then
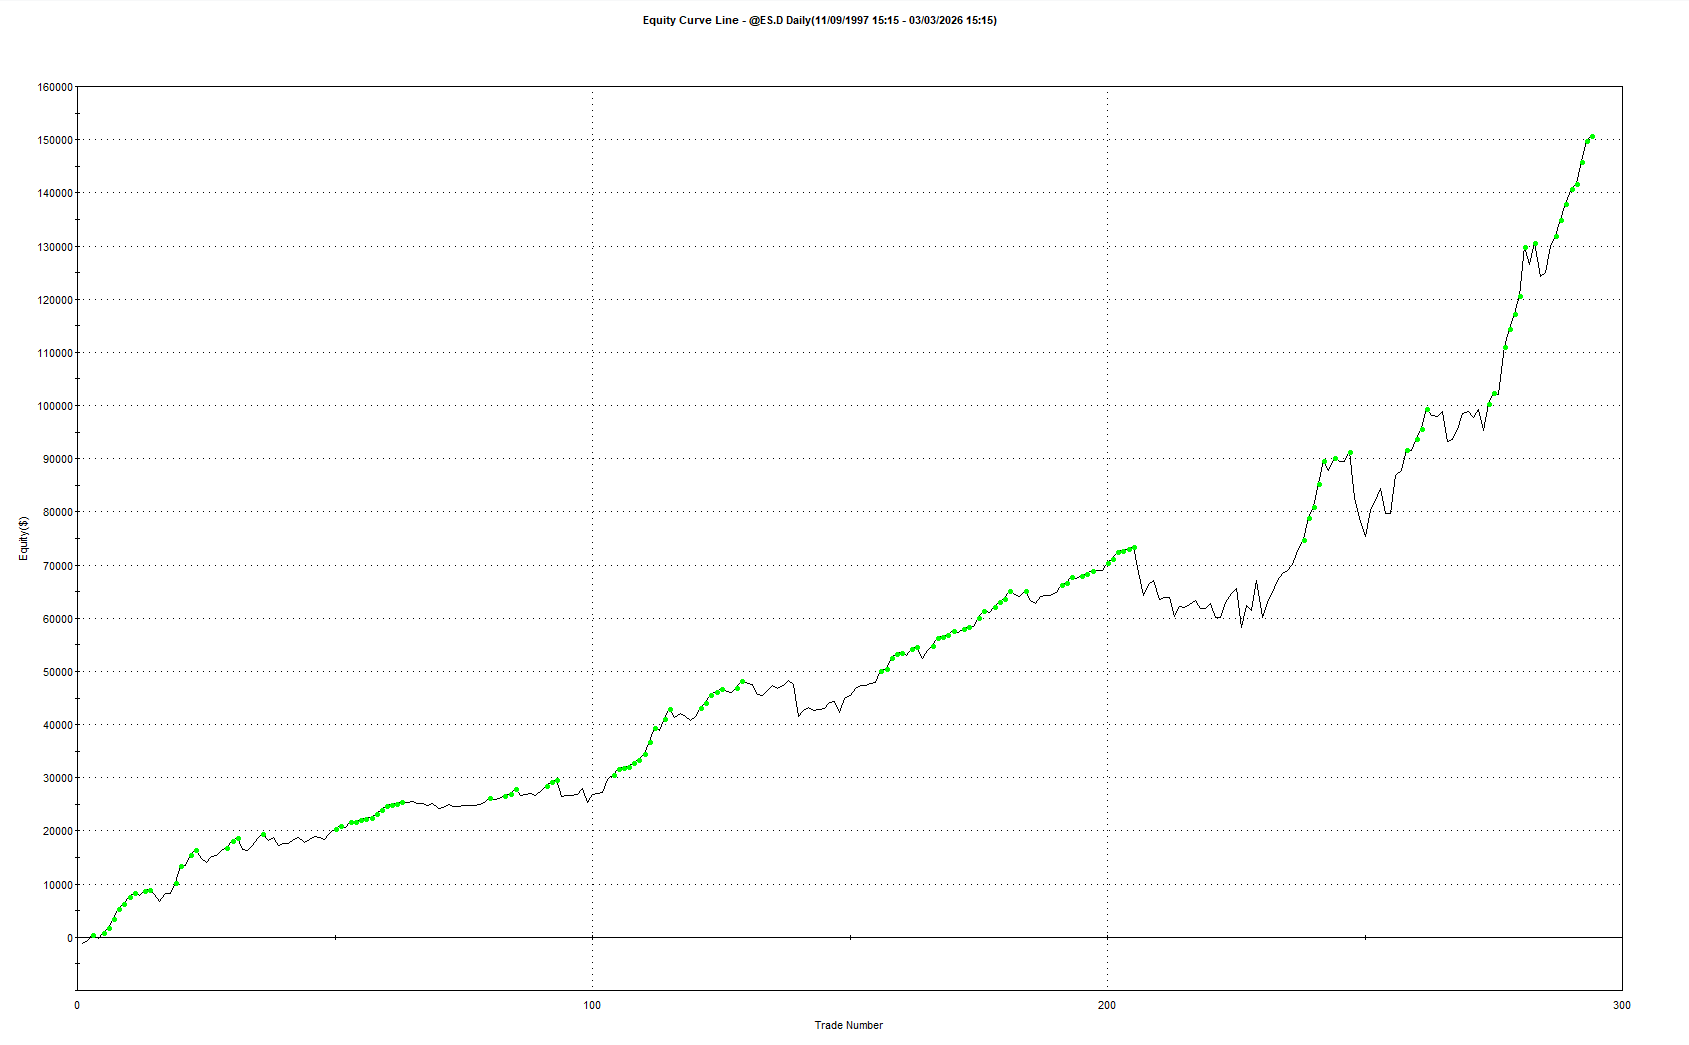
SetStopLoss(StopAmt);Original RSI(2) Strategy on ES.D
Market: ES.D
Reserved bars used: 255
Execution: Next bar at market
Position sizing: 1 Contract
Stops: Optional fixed-dollar stop included in code, but disabled by default to match Connors’ original rules
Equity curve since 1997
Largest Valley / Max Pain (Open Drawdown)

Results since 1997
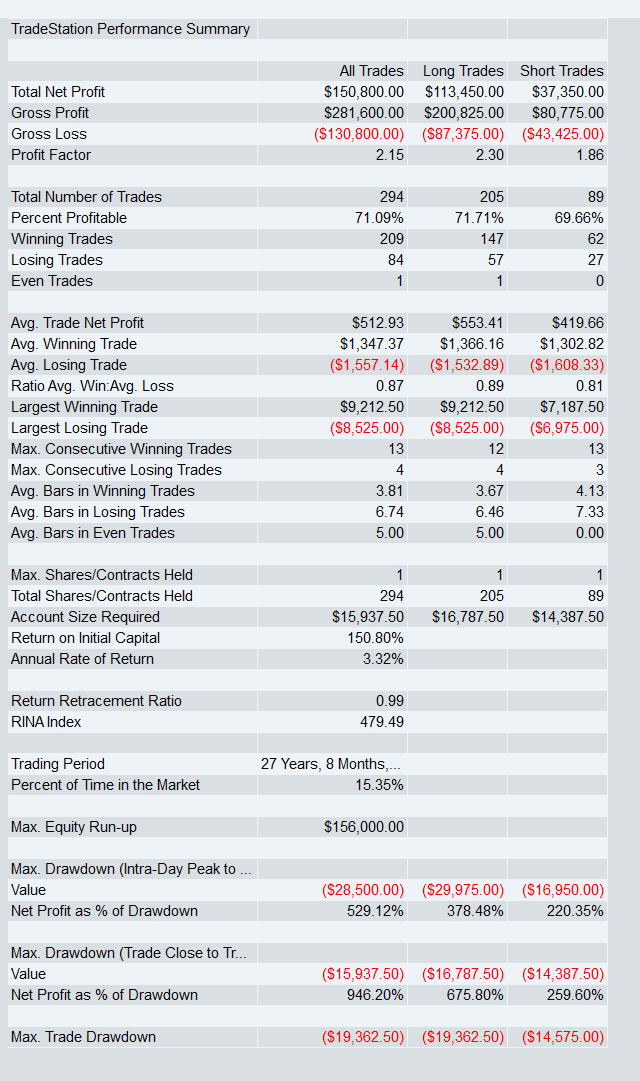
What matters
This baseline gives us the benchmark.
If the original version still holds up after being public for years, then the underlying behaviour is still alive.
And that means we are not looking for a whole new strategy.
We are looking for a smart improvement.
The pro version: adding a VIX filter
This is where the strategy gets more interesting.
The raw RSI(2) setup treats every oversold signal the same.
That is the weakness.
Because not all pullbacks are equal.
Some are healthy dips that snap back fast.
Some are just noise.
And some happen in unstable conditions where mean reversion can keep failing.
That is why the VIX filter is so effective.
It helps us stop asking only:
“Is price stretched?”
And start asking:
“Is this the kind of volatility regime where this stretch is actually worth buying?”
Why this VIX filter works so well
For the pro version, the filter is simple:
Only take trades when the VIX condition is met.
This filter is not trying to buy maximum panic.
It is doing the opposite.
It is keeping the strategy out of the more unstable volatility regimes where oversold can stay oversold and mean reversion can break down.
That is why it works so well.
The original RSI(2) already finds stretched price action.
The VIX filter improves trade selection by saying:
yes to pullbacks in a healthier, more stable volatility regime
no to pullbacks in messy, high stress conditions where drawdowns tend to get worse
This is a very important distinction.
A lot of traders assume mean reversion always gets better when fear gets bigger.
That is not always true.
Sometimes extreme fear is not opportunity.
Sometimes it is instability.
This VIX filter helps avoid that.
Why this matters
It improves the strategy without changing its DNA.
It does not replace the edge.
It refines where the edge is allowed to operate.
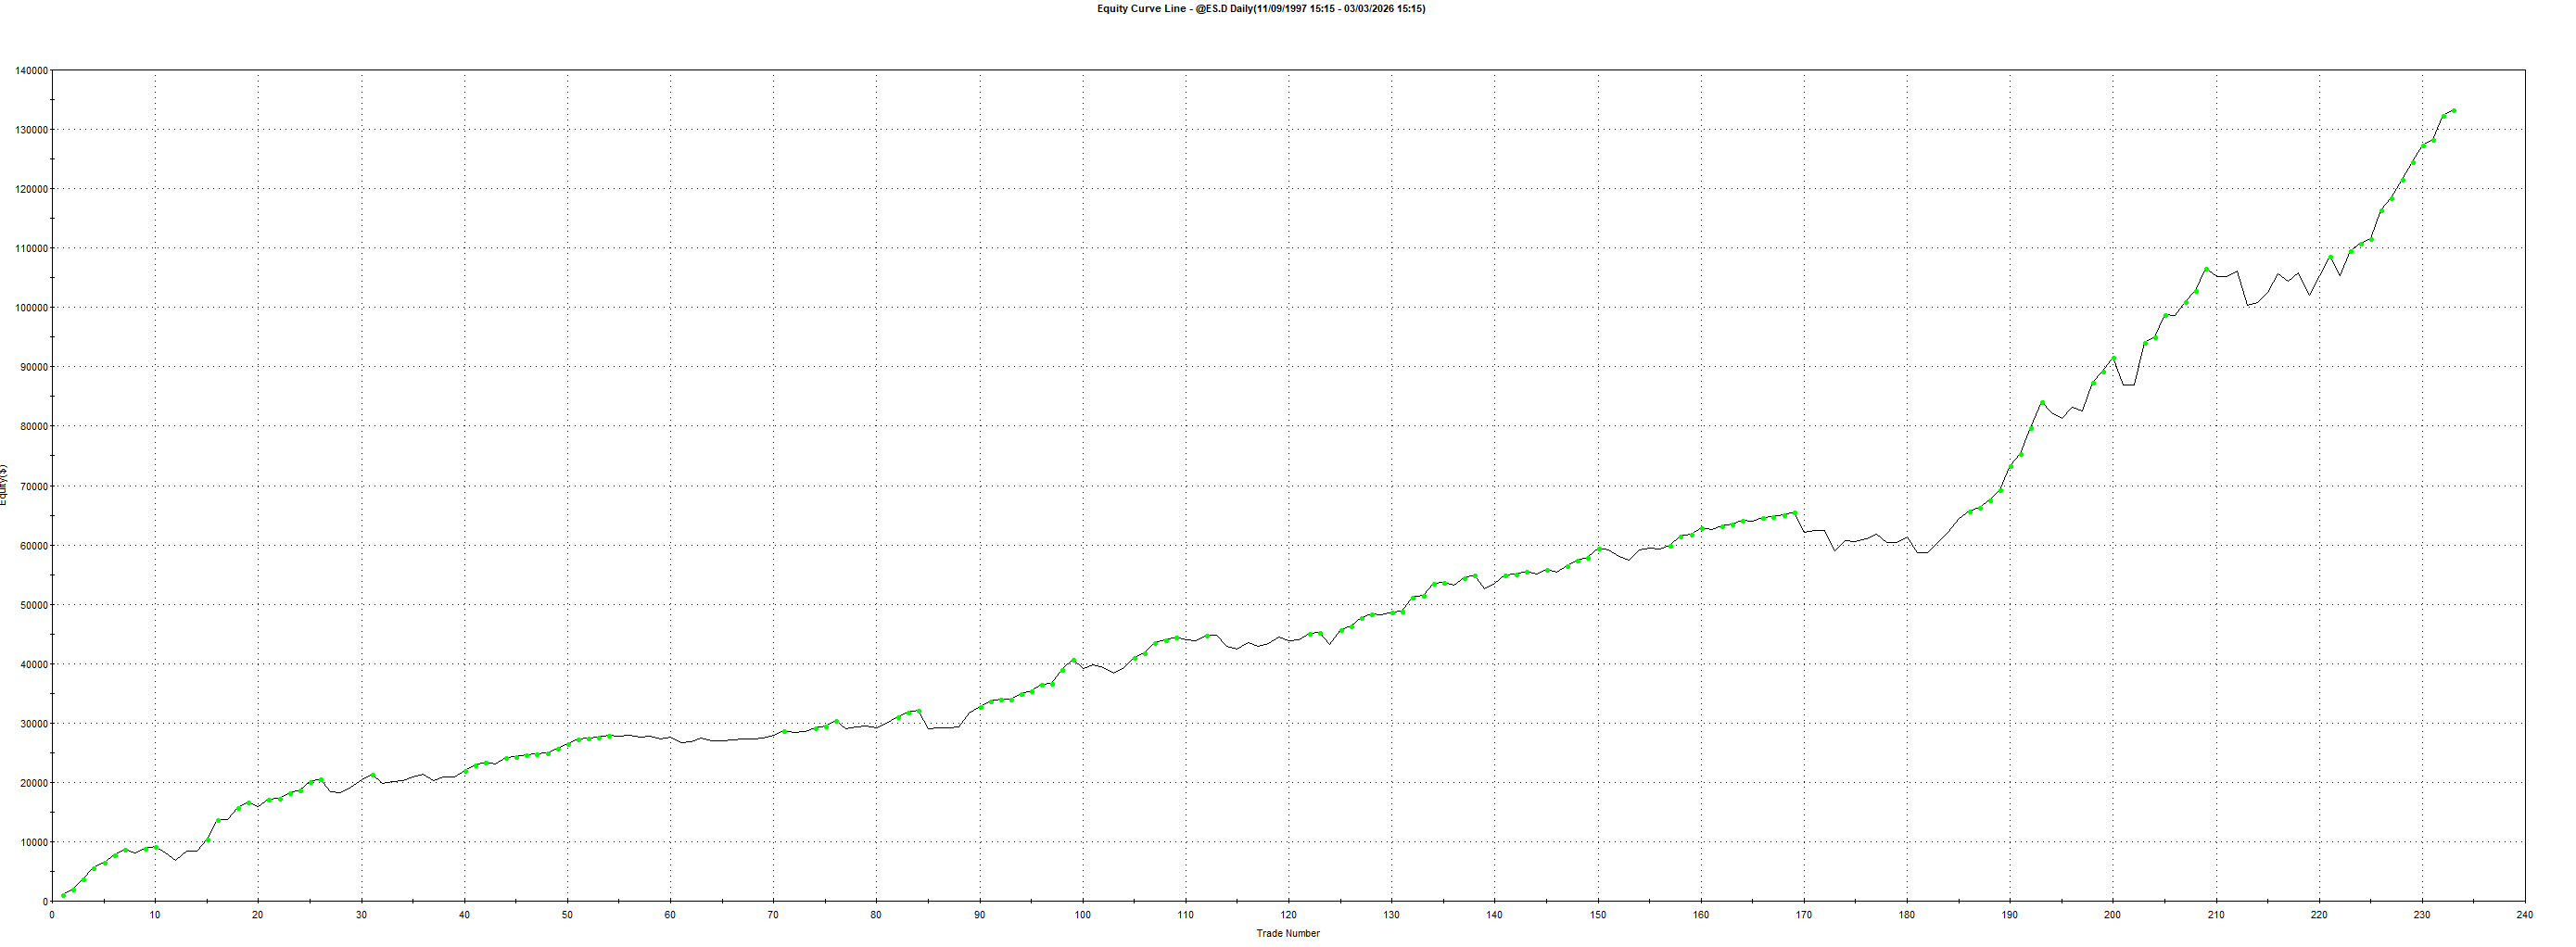
RSI(2) Pro Version on ES.D
By adding the VIX filter to the original strategy, the improvements were meaningful:
Profit factor increased from 2.15 to 2.99
That is a 39.1% increaseAverage trade increased from $512 to $572
That is an 11.7% increasePain-to-gain / return to max drawdown increased from 946% to 1939%
That is a 105.0% increaseLargest Valley / max open drawdown dropped from $19,362 to $10,100
That is a 47.8% reduction in max pain.
That last number is the standout.
The strategy did not just make more money per unit of risk.
It got dramatically easier to hold.
And that matters.
Because a strategy that looks good on paper but is psychologically brutal is not a strategy most traders will stick with.
Equity curve since 1997
Largest Valley / Max Pain

Results since 1997
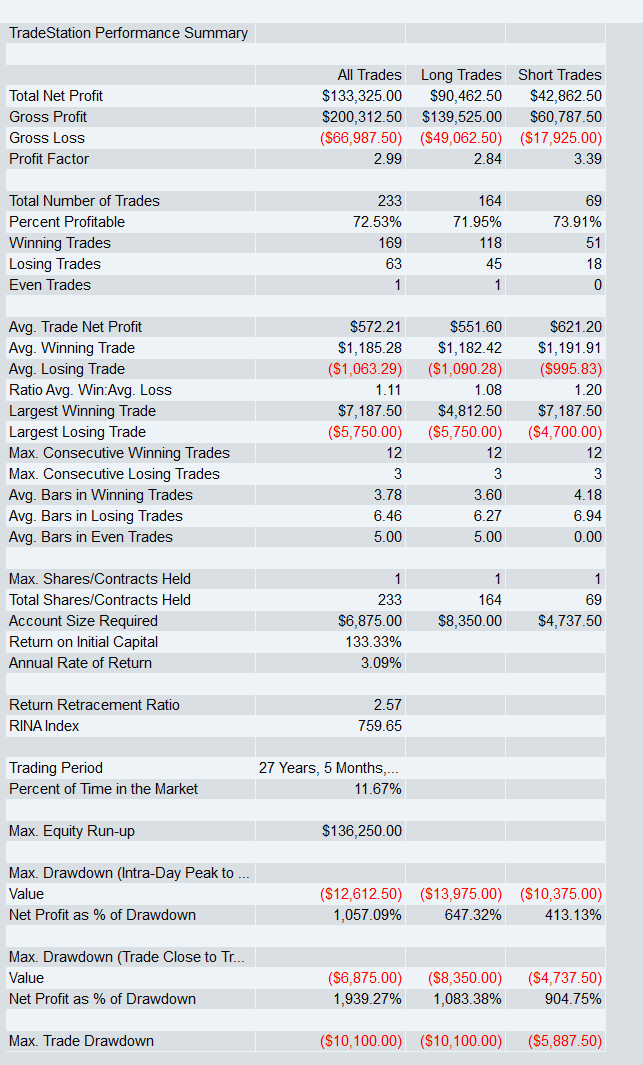
What matters
The biggest improvement here was not just more profit.
It was much better return relative to drawdown and massively lower pain.
That is exactly the kind of improvement worth paying attention to.
Ready to put it to work? The full EasyLanguage code is below.
Dont forget this code can be easily converted to any other trading platform using LLMs and of course this can be run on Micro aswell.
By request, I’ll now include a clear plain English breakdown of each strategy with every parameter so you can rebuild it on your platform.
