Two Simple YM Strategies Built a $154K Portfolio
Same market. Same 15 minute timeframe. Only 0.20 correlation and a 1500% Return to Max Drawdown.

Research and education only. Results are hypothetical and based on backtests and simulations. Past performance does not predict future results. Futures and derivatives involve significant risk. Test on your own data, costs, execution, and infrastructure before trading.
Two strategies.
One market.
Same 15 minute chart.
Combined, they produced $154,350 in profit with a $10,255 maximum drawdown.
Here is the result.
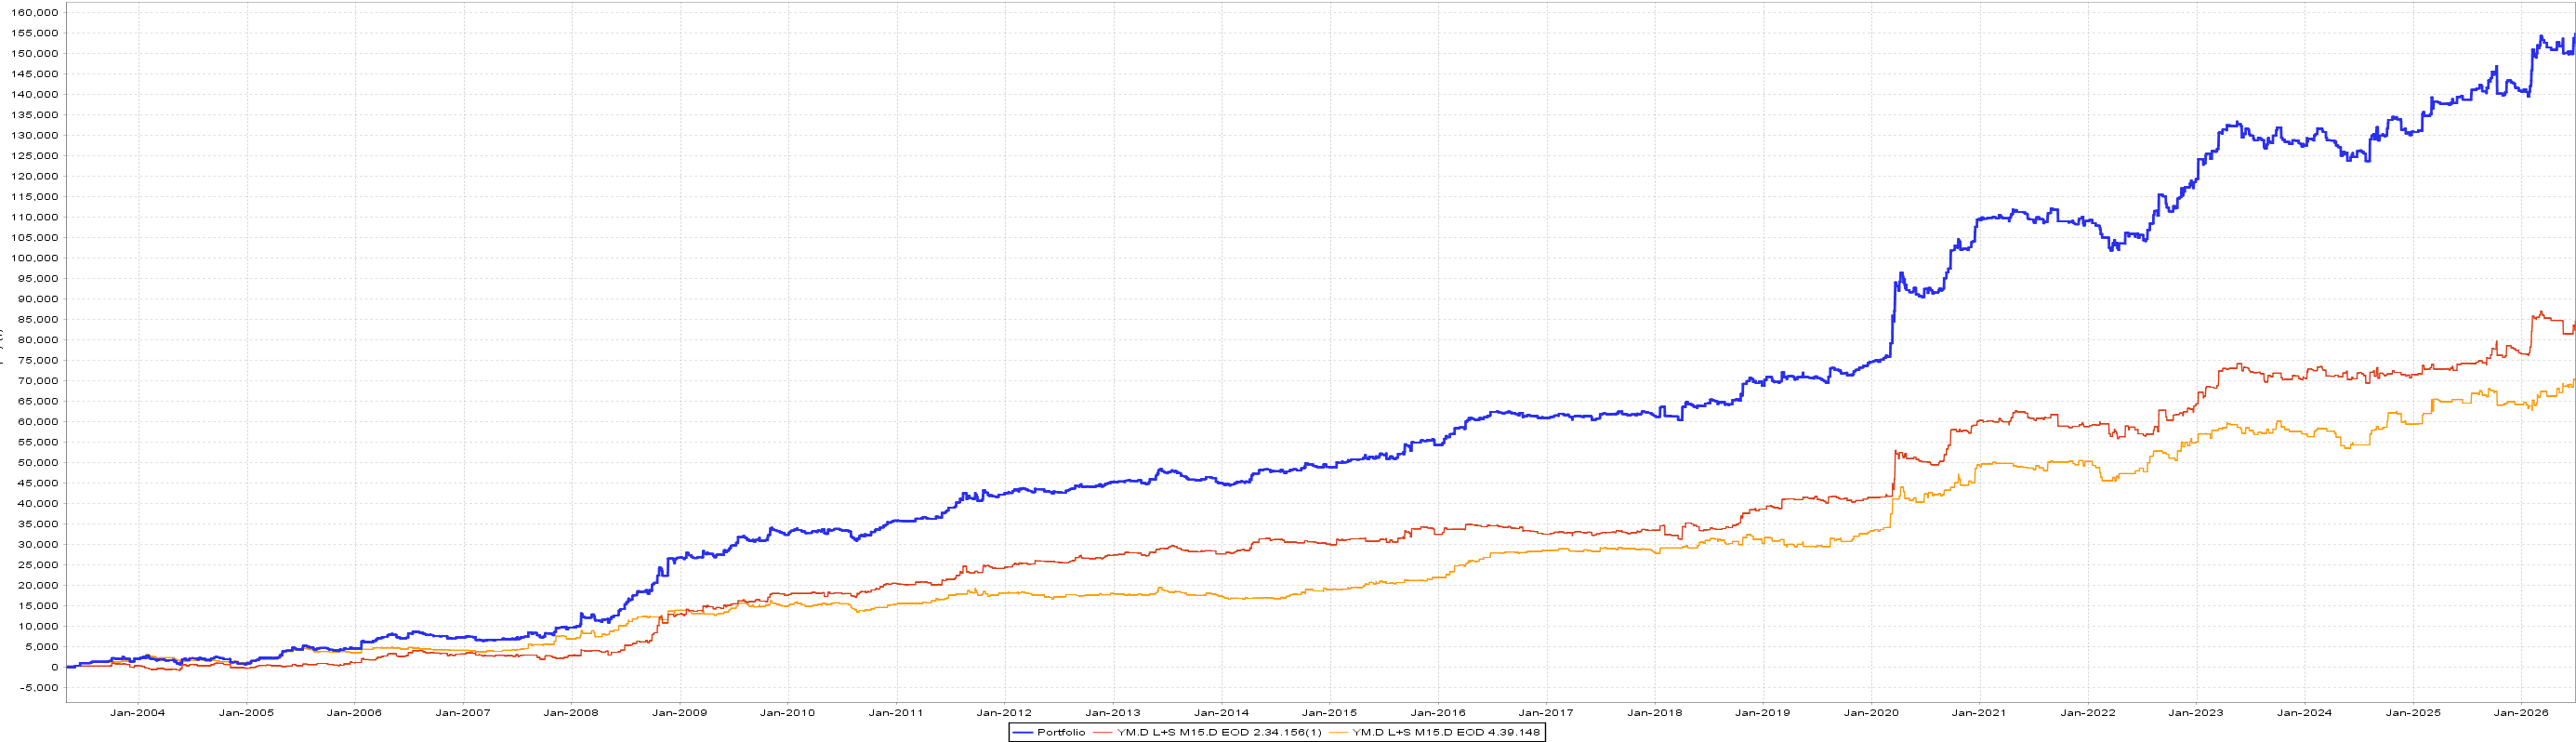
The blue line is the combined portfolio.
The two thinner lines are the standalone strategies.
Both models trade YM. Both use 15 minute bars. Both trade long and short.
Yet their daily returns had only 0.20 correlation.
That is what allowed the portfolio to increase profit faster than drawdown.
The Portfolio at a Glance
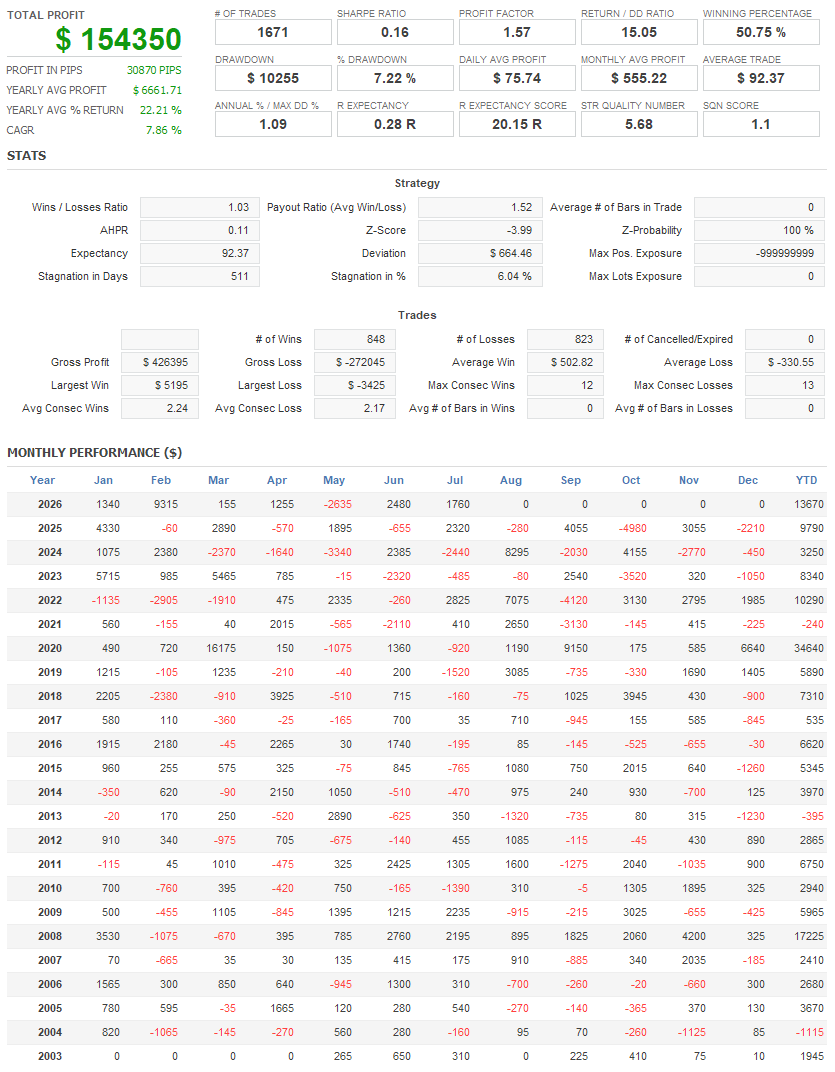
The result did not come from increasing the size of one strategy.
It came from combining two separate YM edges whose difficult periods did not fully overlap.
That is the central lesson of this build.
Diversification comes from different return streams, not simply different market symbols.

Same Market. Different Edges.
Both strategies use:
YM day session data
15 minute bars
A daily secondary data series
Long and short entries
One trade per day
End of day exits
Volatility adjusted risk management
But that is where the similarities end.
Strategy One combines daily candle structure with a longer term directional score. It then waits for YM to reach a defined intraday price.
Strategy Two uses a different daily turning pattern, a different entry calculation and different volatility settings.
Different logic created different trades.
Different trades created different return streams.
Strategy One
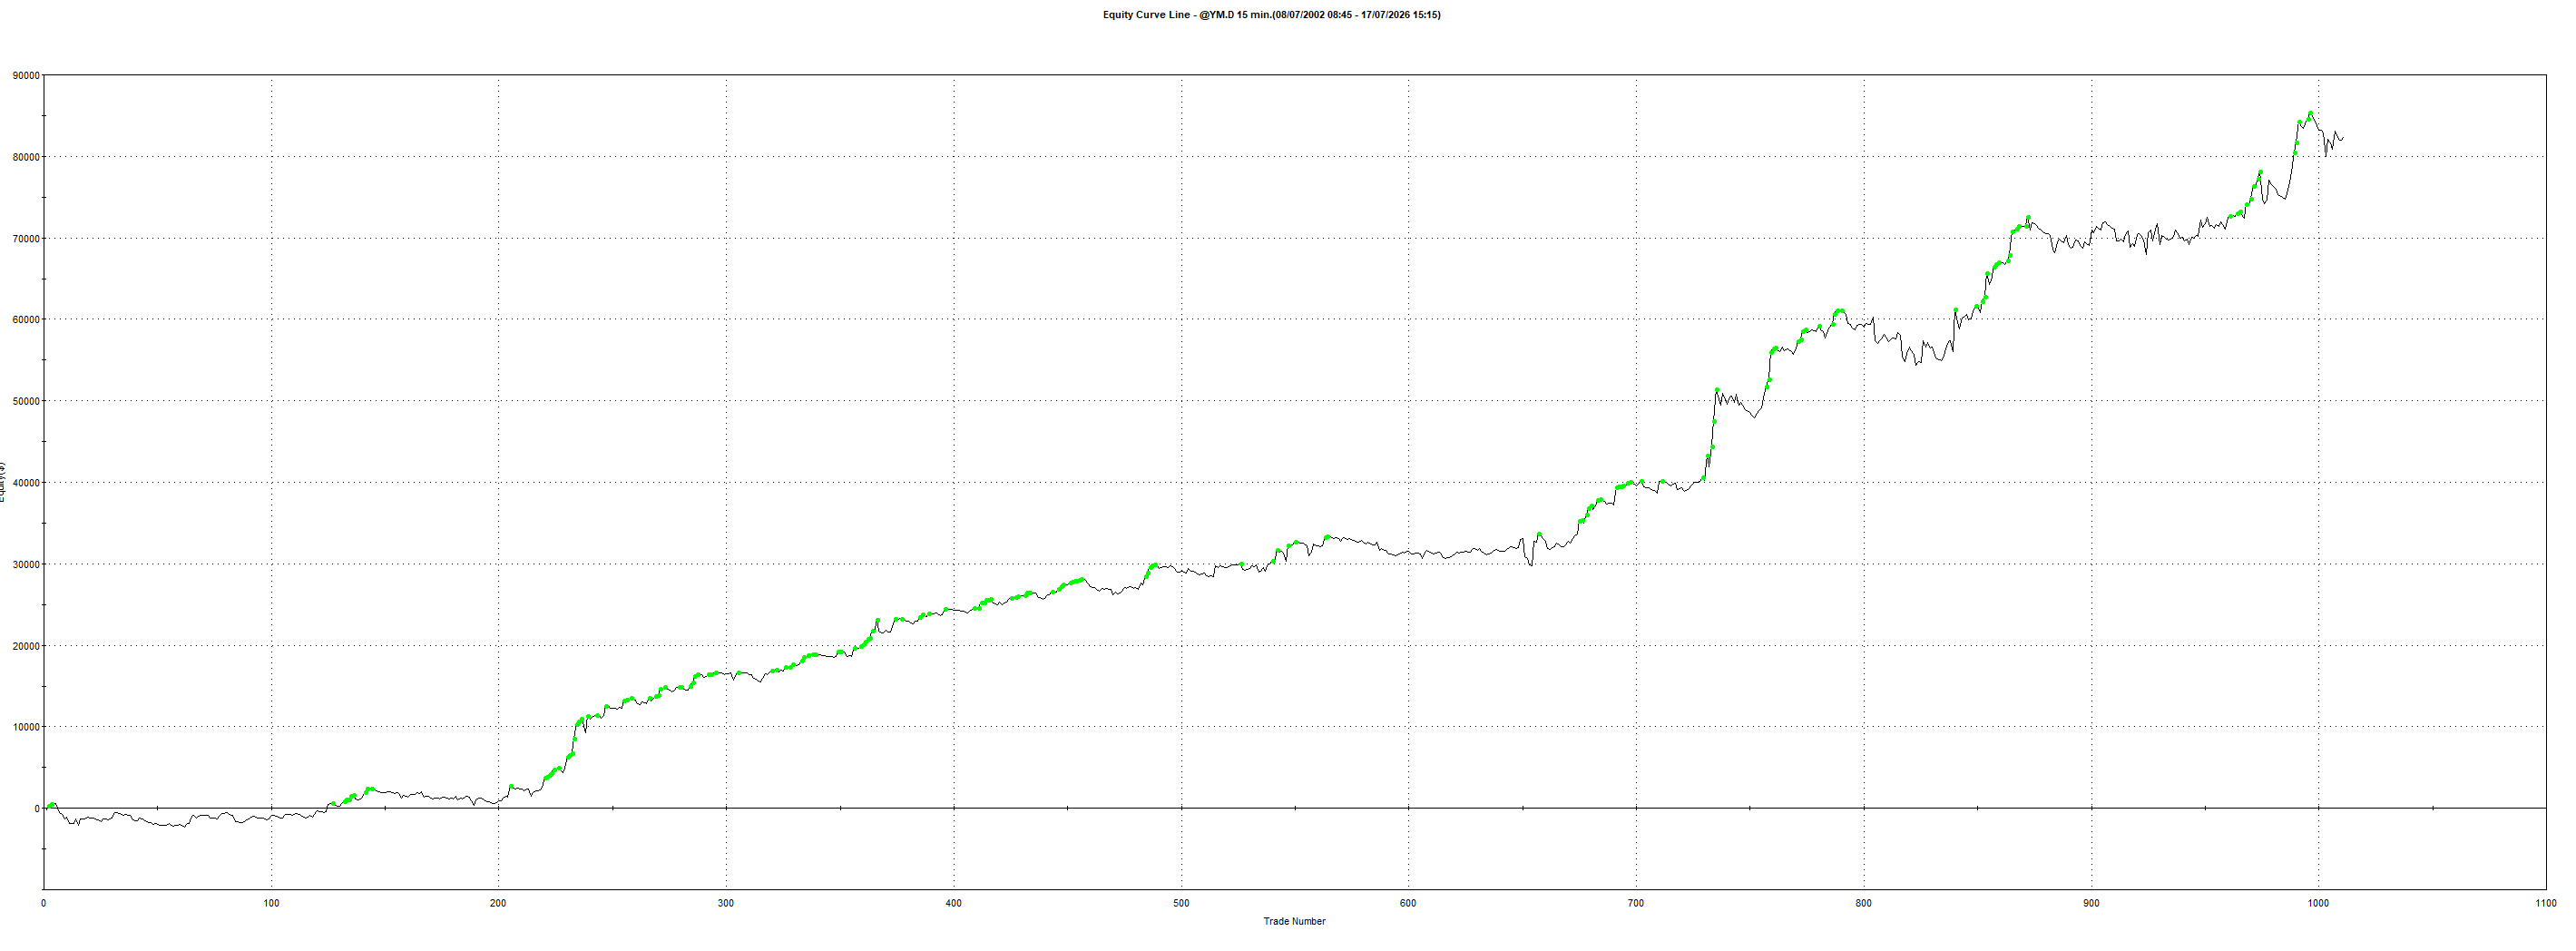
The first model produced:
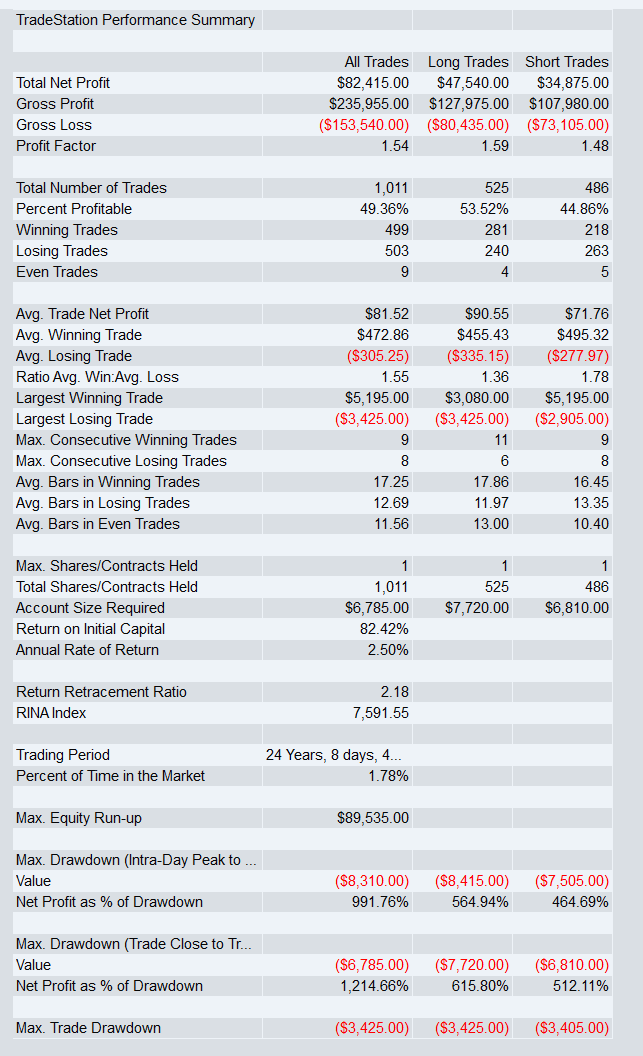
The long side produced $47,540.
The short side produced $34,875.
Both directions contributed, so the model was not relying entirely on the Dow’s long term upward bias.
The equity curve also shows the reality of trading one strategy alone.
There are strong periods, drawdowns and extended sections where progress slows.
That does not automatically mean the edge has disappeared.
It means one model will not suit every market environment.
Strategy Two
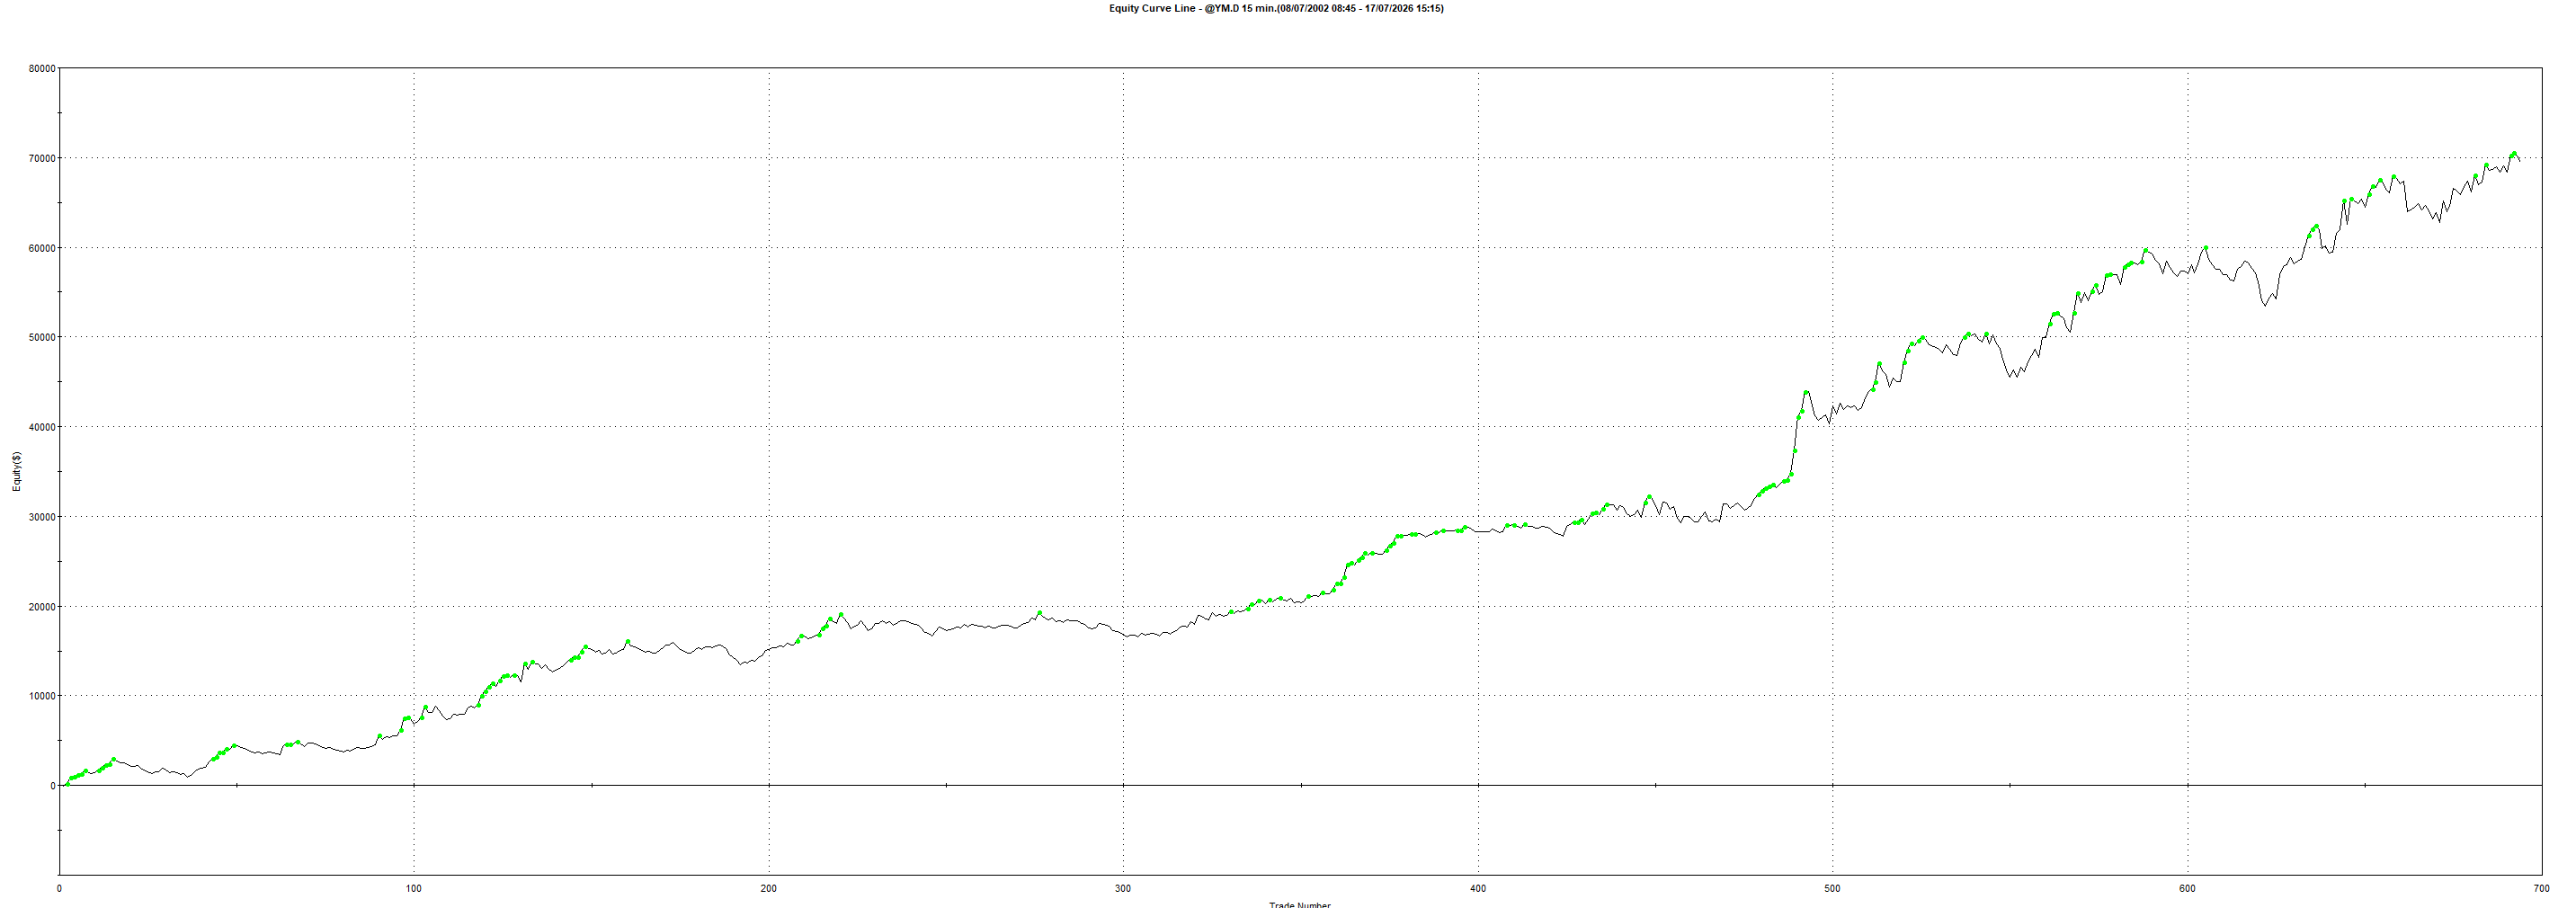
The second model produced:
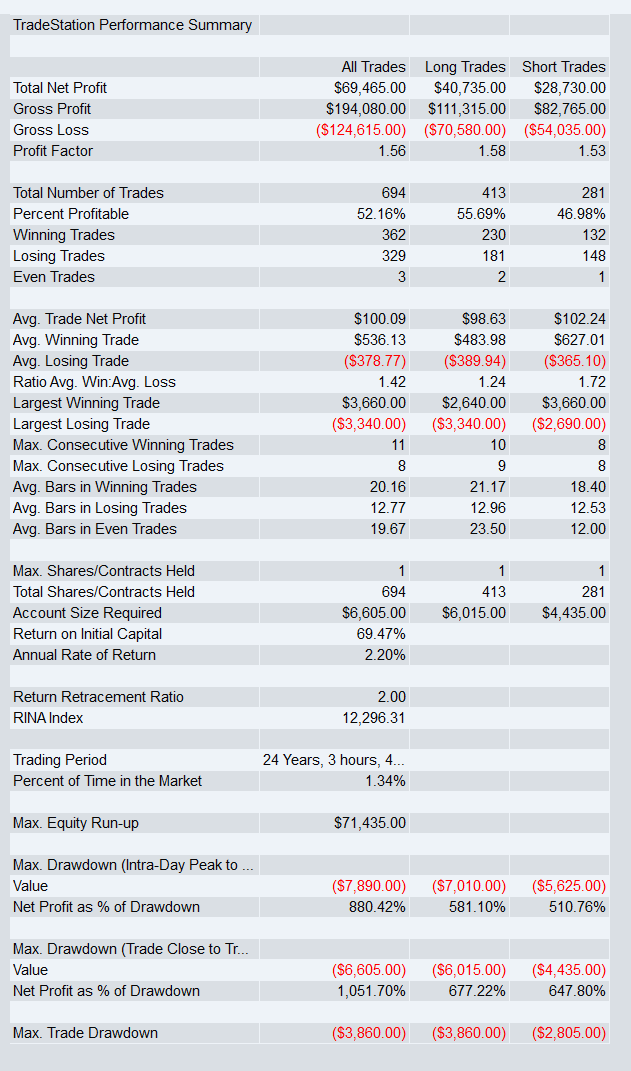
The long side produced $40,735.
The short side produced $28,730.
This model traded less often, but produced a higher average trade.
More importantly, its performance arrived at different times.
Some of its stronger periods occurred while Strategy One was moving sideways. At other times, Strategy One carried the result.
That is exactly what we want before combining two strategies.
Only 0.20 Correlation

The daily return correlation between the two systems was only 20%
A reading of 1.00 would mean the two strategies generally rise and fall together.
A reading closer to zero means their returns behave more independently.
These models still share some exposure because they both trade YM.
But their logic is different enough that the trade results do not closely mirror each other.
This is why measuring strategy returns matters.
Two systems on different markets can still be highly correlated.
Two systems on the same market can provide useful diversification when their signals and trade management are genuinely different.
The Portfolio Improvement
The portfolio took more risk than either standalone model.
That is expected.
But profit increased faster than drawdown.
Portfolio Return to Drawdown improved by approximately:
24% over Strategy One
43% over Strategy Two
Return to Drawdown measures how much total profit was produced relative to the largest historical drawdown.
Higher is better.
We could increase the profit of either strategy by trading more contracts.
That would also increase exposure to the same periods of weakness.
The portfolio improved risk efficiency by adding another edge instead.
Performance Was Widely Distributed
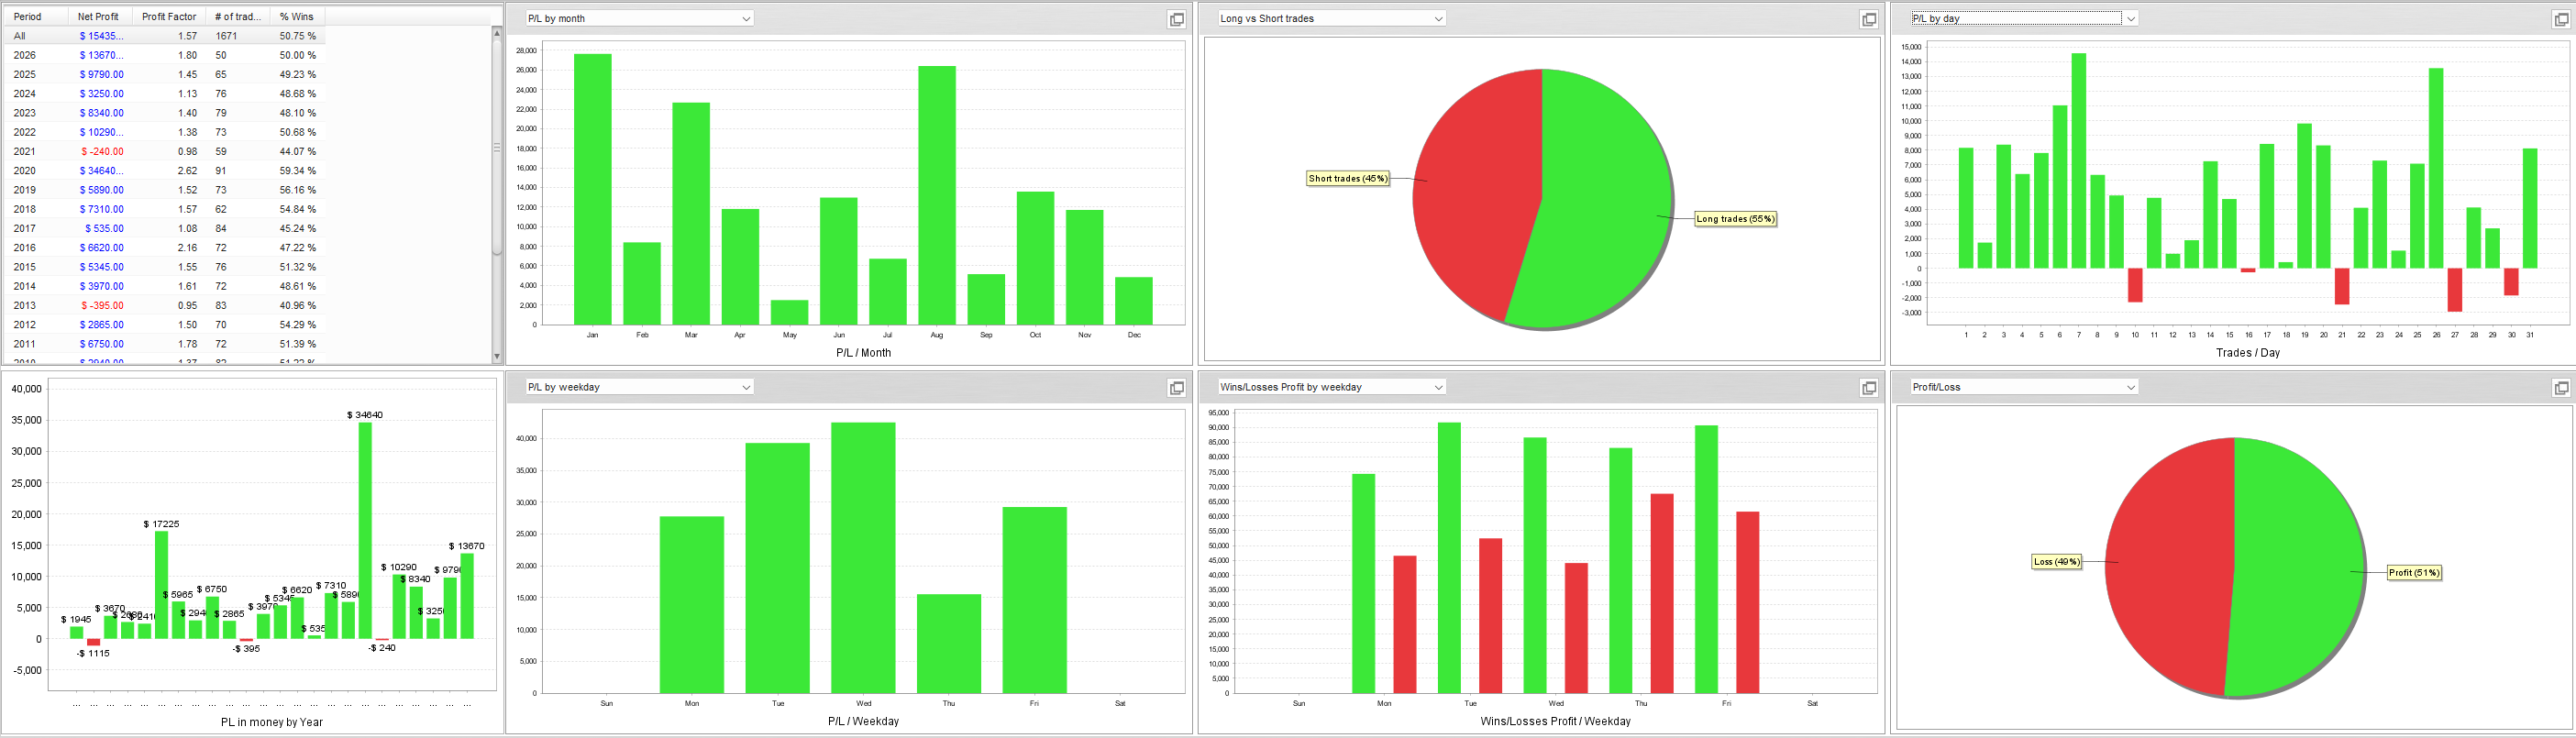
The portfolio was reasonably balanced between trade directions:
55% long trades
45% short trades
Every calendar month was profitable in the aggregate.
Every trading weekday was also profitable.
That does not mean every future month or weekday will remain positive.
It shows that the historical result was not dependent on one narrow day, month or direction.
Does It Depend on Exactly 15 Minute Bars?
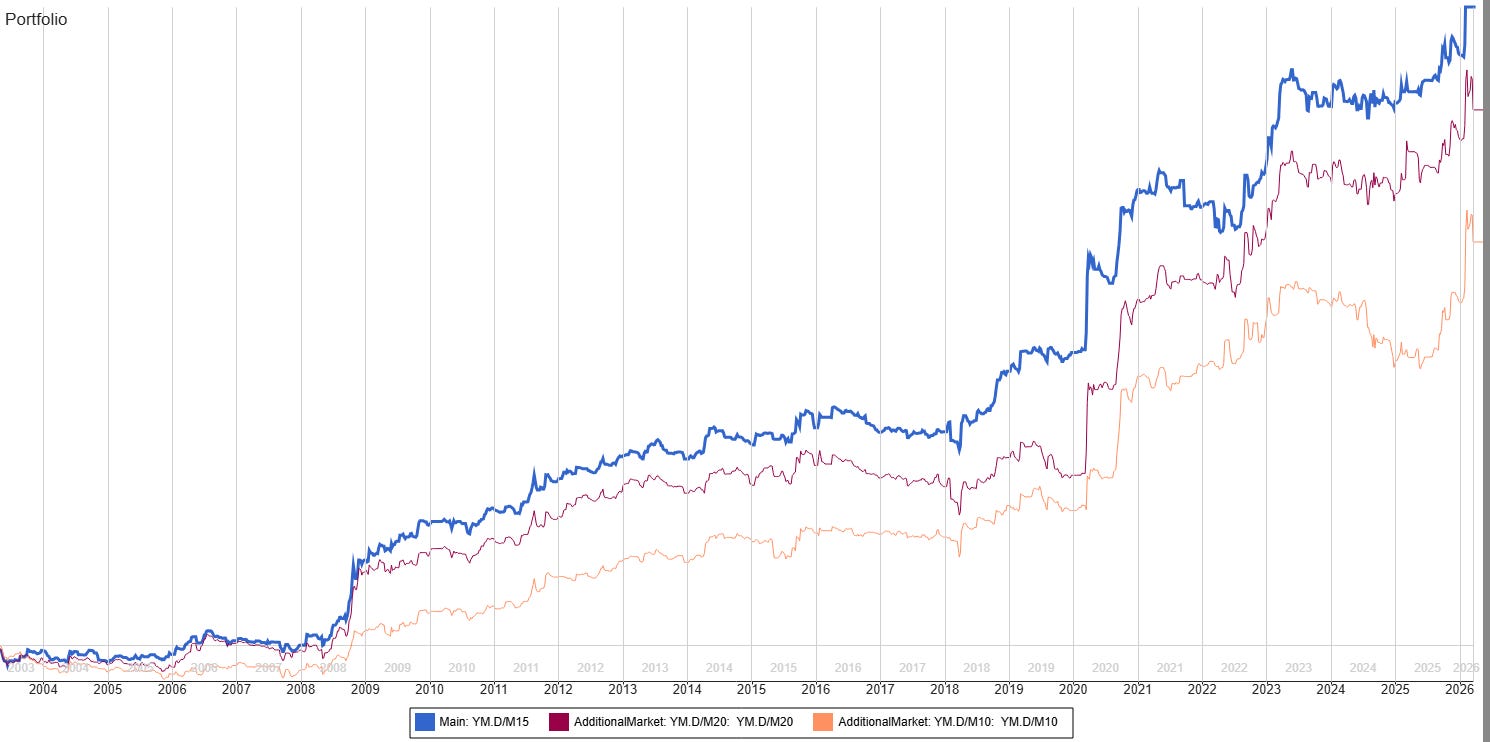
The strategies were tested across neighbouring intraday timeframes, including 10 and 20 minute bars.
The results changed, as expected.
But the broad portfolio behaviour remained profitable.
That matters because a real edge should not disappear completely when the chart interval moves slightly.
We are not looking for identical results.
We are looking for the underlying behaviour to remain visible.
Monte Carlo: Randomised Market Data
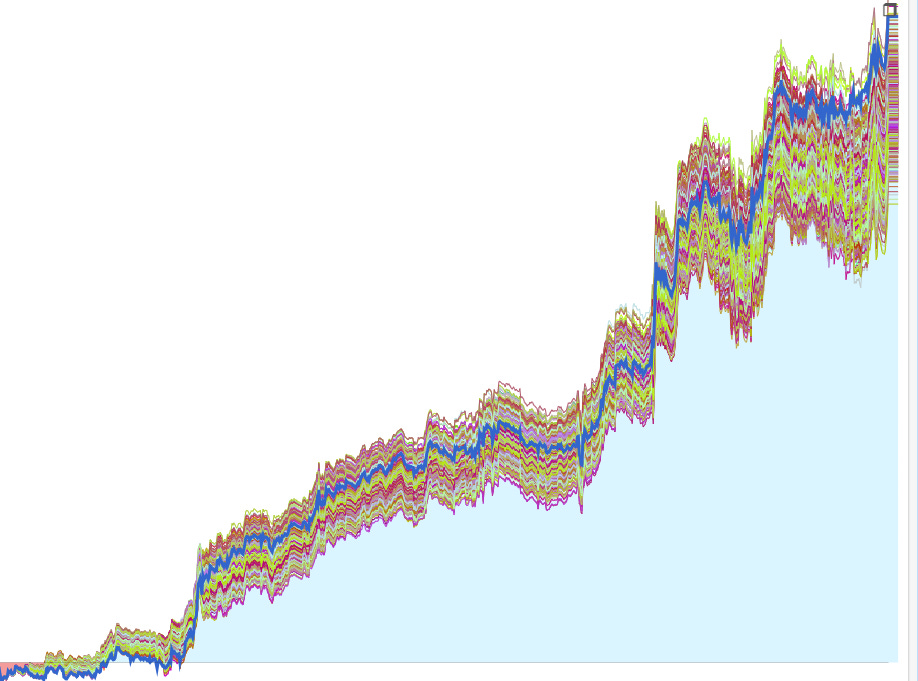
This test altered the historical OHLC data while retaining the broader characteristics of the market.
The original result remained inside a large group of profitable alternatives.
This suggests the portfolio was not entirely dependent on one exact sequence of historical bars.
A More Realistic Expectation
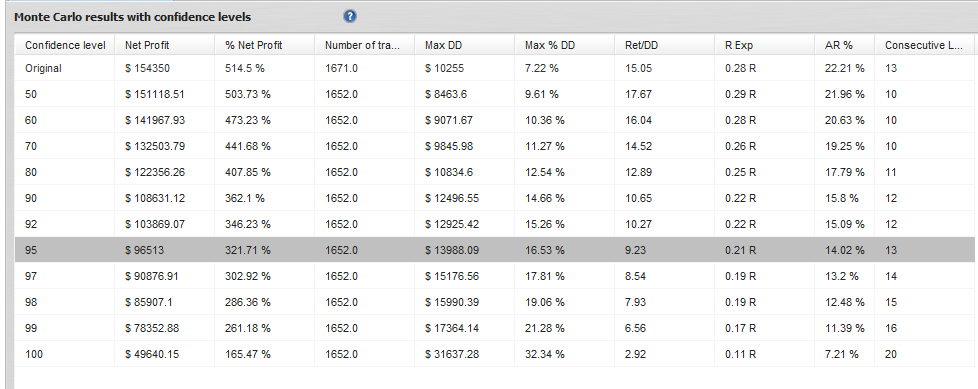
The original portfolio produced:
$154,350 net profit
$10,255 maximum drawdown
15.05 Return/DD
At the 95% Monte Carlo confidence level:
Net profit fell to $96,513
Maximum drawdown increased to $13,988
Return/DD fell to 9.23
Maximum consecutive losses reached 13
That represents approximately:
37% less profit
36% more drawdown
The stressed result remained profitable.
But it is far less attractive than the original equity curve.
That is the version we would use when setting expectations.
The historical test shows what happened.
Monte Carlo shows how different the experience could have been.
Why This Build Matters
These two models trade:
The same market
The same timeframe
The same session
The same contract size
The same long and short directions
Yet their daily correlation was only 0.20.
The diversification came from different logic.
That is a useful reminder for portfolio builders.
You do not always need another market.
Sometimes you need another genuinely different way to trade the market you already understand.
Get Both Complete YM Strategies
Most strategy articles stop after showing the equity curve.
This one does not.
Below, we provide:
Both complete TradeStation EasyLanguage strategies
The exact Data1 and Data2 setup
Every input used in the tests
Daily signal calculations
Intraday entry logic
Initial stop logic
Trailing stop logic
End of day controls
Position sizing settings
Reserved bar requirements
These are complete long and short systems, not simplified examples.
You can reproduce the research, test both models independently, apply your own costs and build the portfolio on your own data.
Paid subscribers also gain access to our growing strategy library, portfolio research and upcoming tools.