Your Best Strategy Will Go Quiet. Build a Portfolio Instead
ORB and RSI2 both work, but together they work better. See how two low correlation strategies improved Ret/DD to 18.34 and reduced the pain of stagnation.

Most trading results you see online suffer from the same problem.
They show the destination, but they hide the road.
A strategy can finish with a beautiful equity curve and still spend years doing absolutely nothing. That dead period is called stagnation. It is one of the hardest parts of systematic trading because it messes with your head.
Before we go further, this article builds directly from two strategies I have already published. If you missed either of them, make sure to check them out first because today we are going to combine both into a portfolio and show why the pairing works so well.
Strategy 1: RSI2 ES.D + VIX Filter

Strategy 2: NQ ORB Strategy

Both strategies are strong on their own, but the real magic happens when we stop looking at them in isolation.
You can have a real edge, a profitable system, solid long term results, and still sit through months or years where nothing happens.
That is why I am always cautious when I see people promote one strategy like it is the answer to everything.
Especially the ORB.
Opening Range Breakout strategies are everywhere. YouTube, Twitter, Discord, paid groups, courses. Everyone has a version. Buy the high, sell the low, simple.
And to be fair, the idea has merit.
But long track records are rare for a reason. Most strategies have good periods and bad periods. A model can be hot for two years, then go flat for three. That does not mean it is broken. It means it is behaving like a strategy.
The real question is:
What do you do when your best strategy goes quiet?
That is where portfolio building comes in.
The Problem With Stagnation
Stagnation is the period between equity highs.
It is not always the same as drawdown. Sometimes the strategy is not losing much. It is just not making new highs.
That can be worse emotionally because you start asking the wrong questions.
Is it broken?
Should I stop trading it?
Should I increase size to make up for lost time?
Should I throw it away and start over?
This is why a single strategy is hard to trade.
Even a good one.
Below is our NQ ORB strategy. This is already a heavily improved version of the standard ORB you see promoted online. Our version has a much better structure, better average trade, fewer trades, and far less dead time than the original idea.
But even our version has long periods where performance is lacklustre.
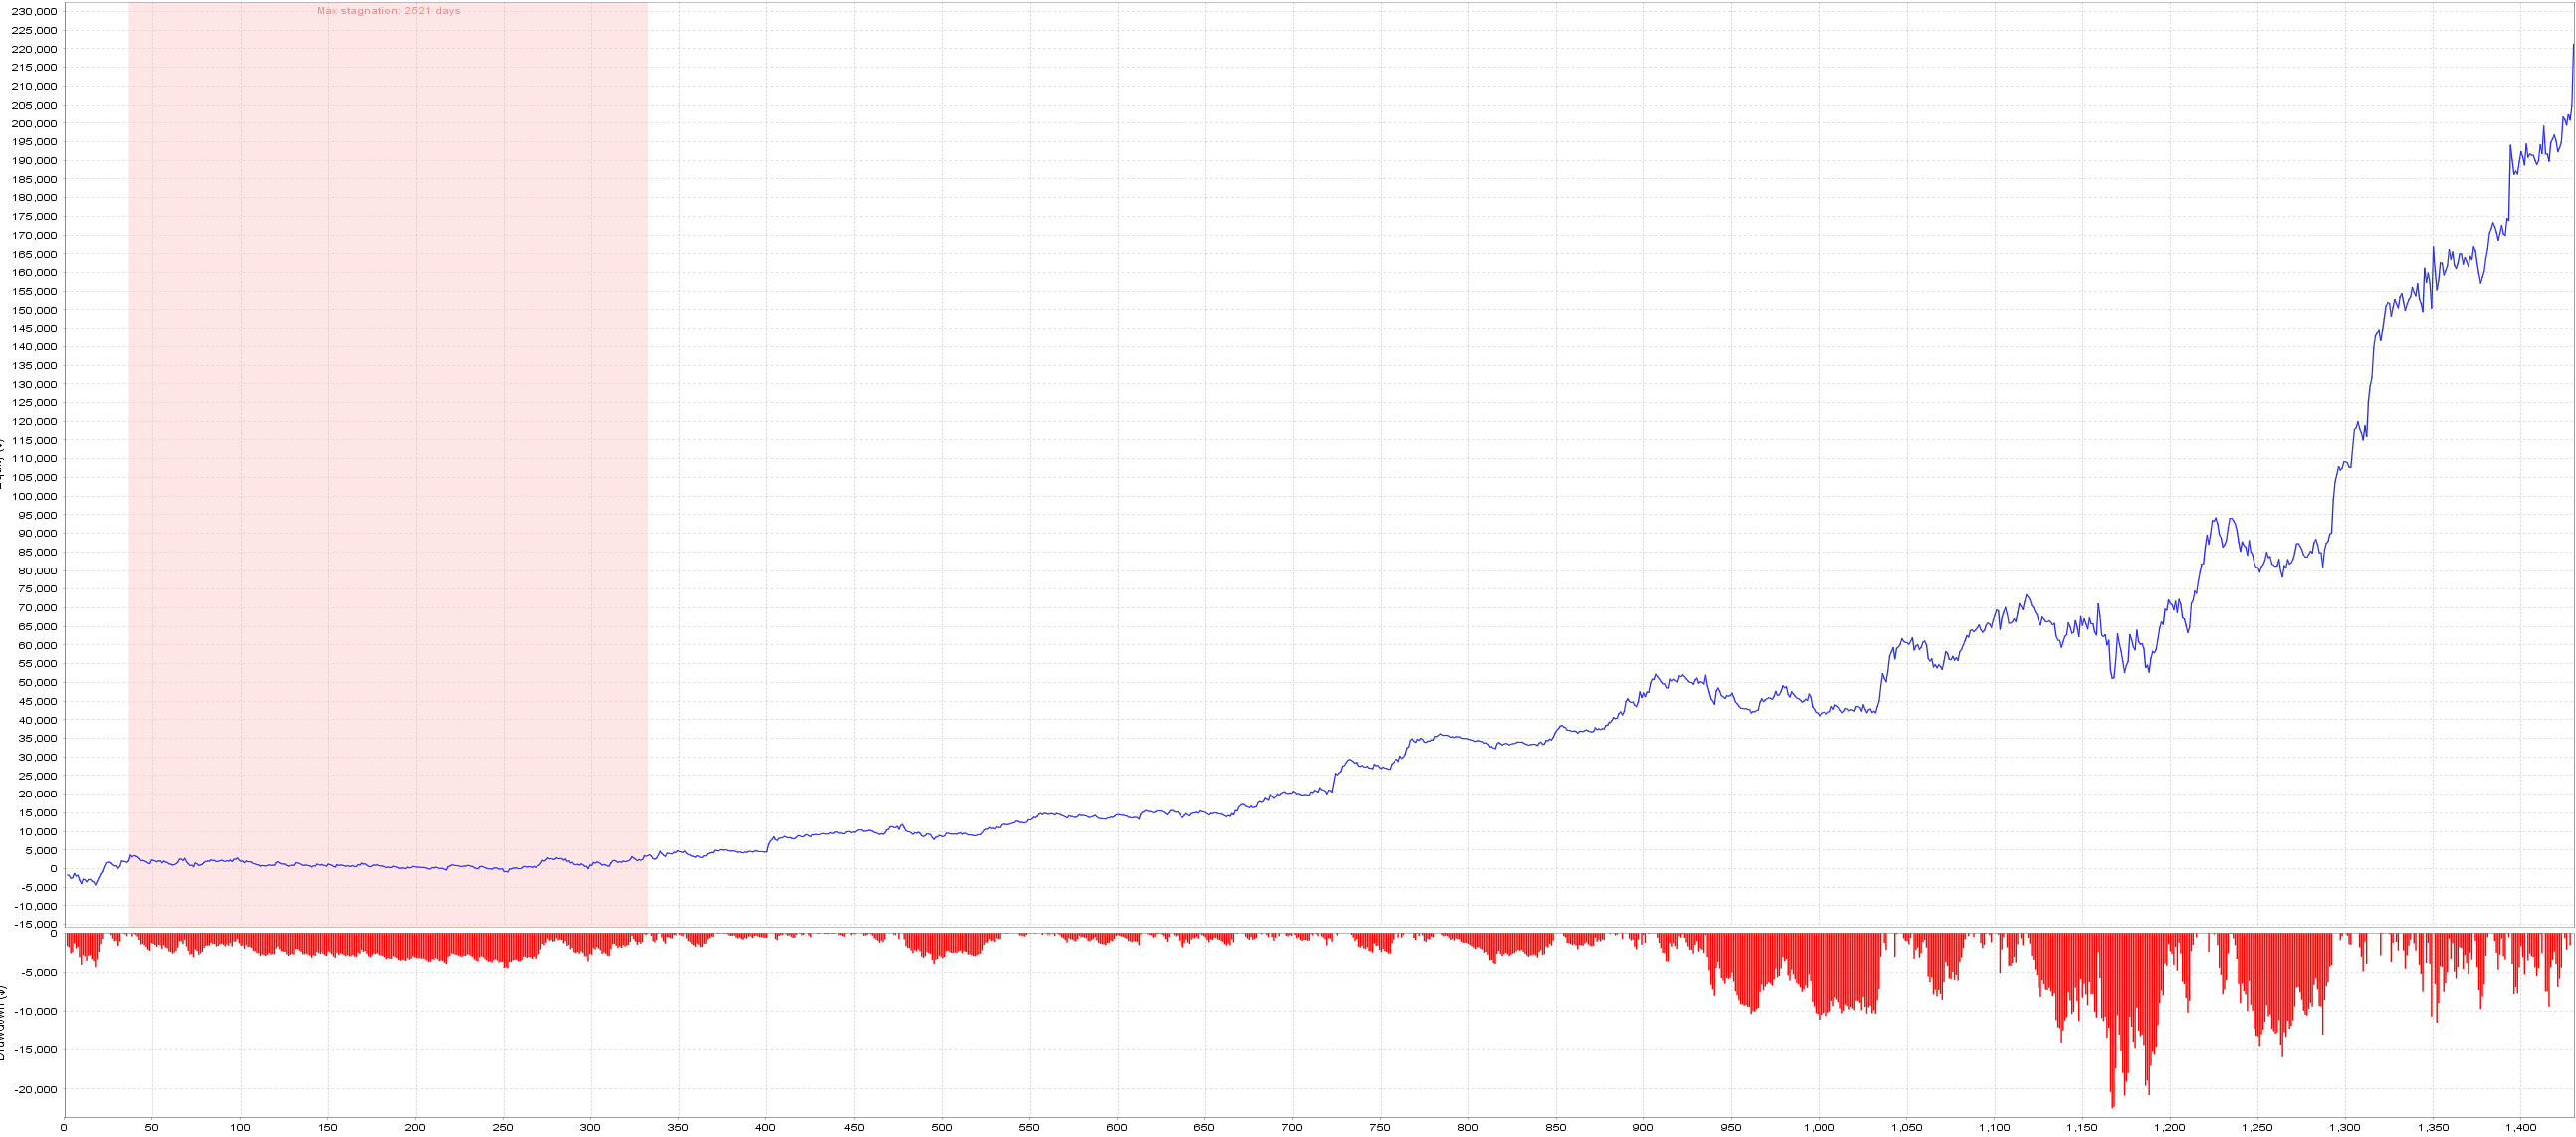
Note: The pink shaded section highlights the stagnation period. This is the time where the strategy stops making new highs and effectively goes sideways. It may not look dramatic, but this is often the hardest part to sit through as a trader.
That is not a failure. That is reality.
Strategies breathe. They cycle. They go through periods where the market is not rewarding that behaviour.
The job is not to pretend stagnation does not exist.
The job is to build around it.
Strategy 1: Our NQ ORB Model
The first piece is our version of the Opening Range Breakout.
The classic ORB is probably one of the most promoted day trading strategies on the internet. The idea is simple, and that is why people love it.
Define the opening range.
Trade the breakout.
Close by the end of the day.
Simple. Visual. Easy to sell.
But simple does not always mean robust.
In the original ORB article, I showed why the classic version has problems when tested properly across a long sample. Our version rebuilt the idea with better structure, a daily filter, proper exits, and cleaner risk control.
Today, we are using that improved ORB as one half of the portfolio.
NQ ORB results
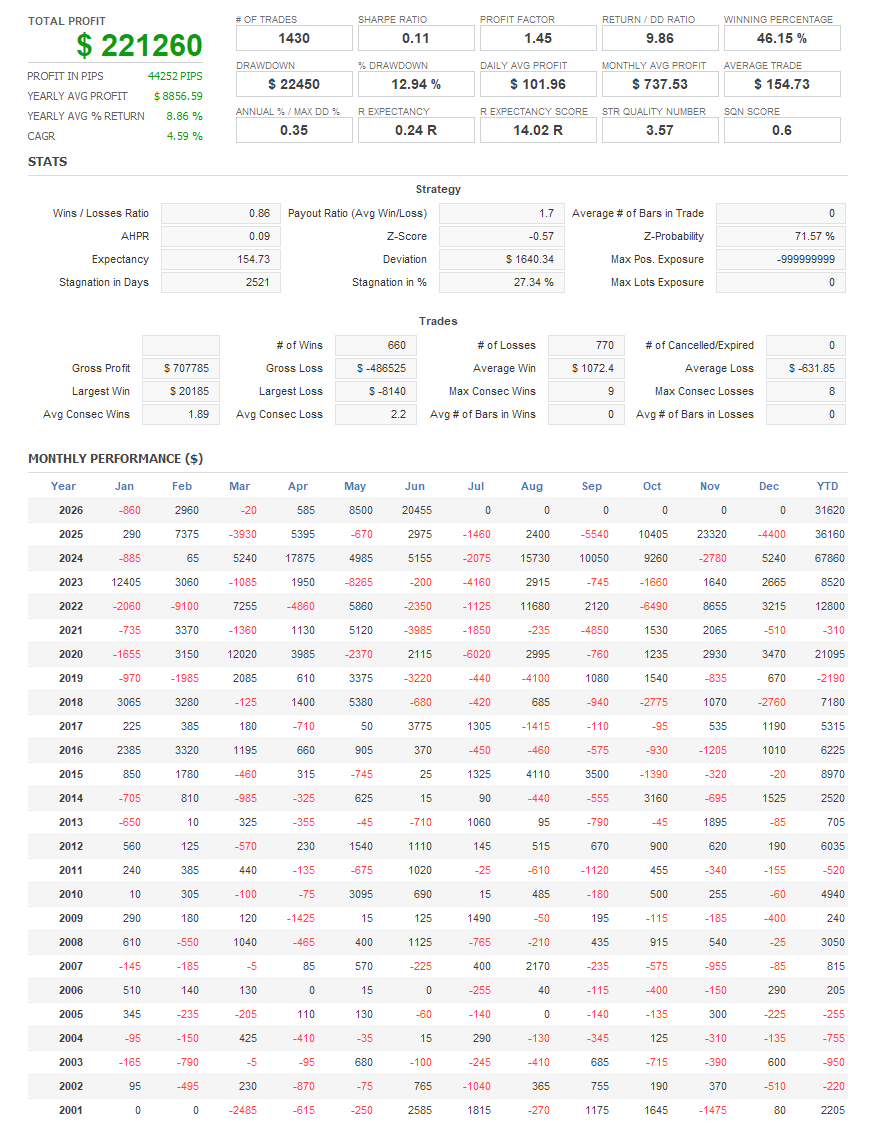
From the results:
Total profit: $221,260
Trades: 1,430
Profit factor: 1.45
Return/DD: 9.86
Win rate: 46.15%
Drawdown: $22,450
Average trade: $154.73
This is a solid strategy.
But it still has periods where it goes quiet.
That is the point of today’s article.
We are not trying to pretend one good strategy is enough.
We are trying to build something more durable.
Strategy 2: ES RSI2 With VIX Filter
The second piece is our RSI2 strategy on ES with a VIX filter.
This is a completely different type of edge.
The ORB is an intraday breakout style model. It is looking for expansion after a defined opening structure.
The RSI2 strategy is different. It is a mean reversion style model. It looks for short term exhaustion, but only when the broader structure makes sense.
This is exactly what we want in a portfolio.
Different logic.
Different trade behaviour.
Different market exposure.
Different pain periods.
ES RSI2 results
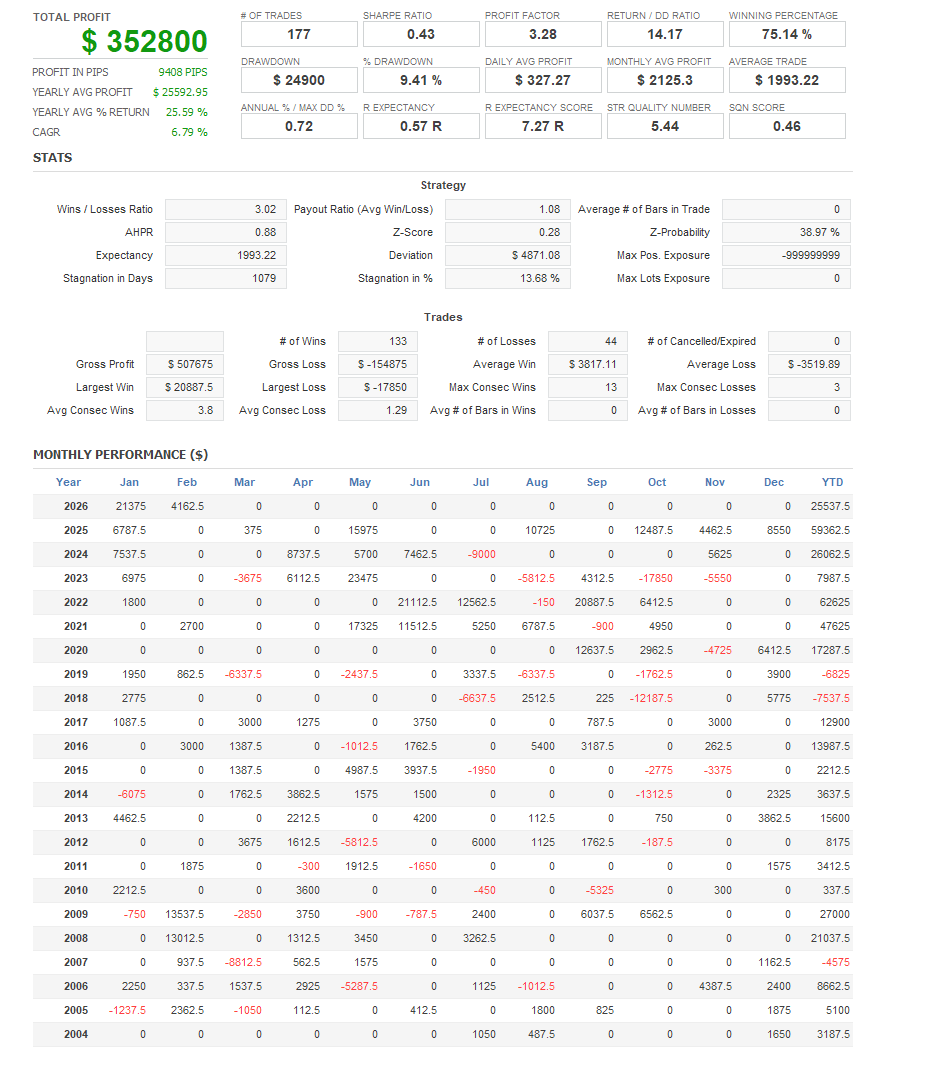
From the results:
Total profit: $352,800
Trades: 177
Profit factor: 3.28
Return/DD: 14.17
Win rate: 75.14%
Drawdown: $24,900
Average trade: $1,993.22
This is a very strong standalone system.
But again, even strong systems can go through quiet periods.
That is why we do not stop at one strategy.
The Superpower of Quant Trading
This is where quant trading has a real advantage.
A discretionary trader usually has one main style.
Maybe they trade breakouts.
Maybe they trade pullbacks.
Maybe they trade news.
Maybe they trade one market they know well.
That can work, but it creates dependence on one environment.
As systematic traders, we can do something different.
We can trade multiple edges at the same time.
Not just more trades.
Not just bigger size.
Actual different return streams.
This is the part I think most people miss.
The goal is not to take one strategy and size it until the account looks exciting.
The better path is usually to add exposure through different markets and different strategies, not simply by pushing position size higher on one idea.
That is a big difference.
If you just increase size on one system, you increase the same risk.
If you add another low correlation system, you may increase return while smoothing the ride.
This is why portfolio construction matters.
Ray Dalio has made this idea famous through his “holy grail” concept: build a group of good, uncorrelated return streams rather than relying on one source of return. We are not just stacking trades. We are stacking different behaviours.
Why These Two Fit Together
The ORB strategy and RSI2 strategy are almost perfectly uncorrelated in this test.
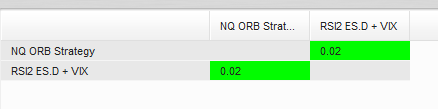
The correlation shown is:
NQ ORB Strategy vs RSI2 ES.D + VIX: 0.02
That is exactly what we want.
A correlation of 0.02 means the two strategies are barely moving together.
That does not mean both make money every month.
It does not mean drawdowns disappear.
It does not mean the portfolio is risk free.
But it does mean one strategy is not simply a clone of the other.
That matters.
If ORB is quiet, RSI2 may still be working.
If RSI2 is flat, ORB may still be producing.
If both are working, the portfolio accelerates.
If one is in a bad patch, the other can help carry the load.
That is the entire point.
The Portfolio Result
This is where the benefit becomes obvious.
On their own, both strategies are strong. But the real improvement comes when we stop looking at them individually and start looking at them as a portfolio.
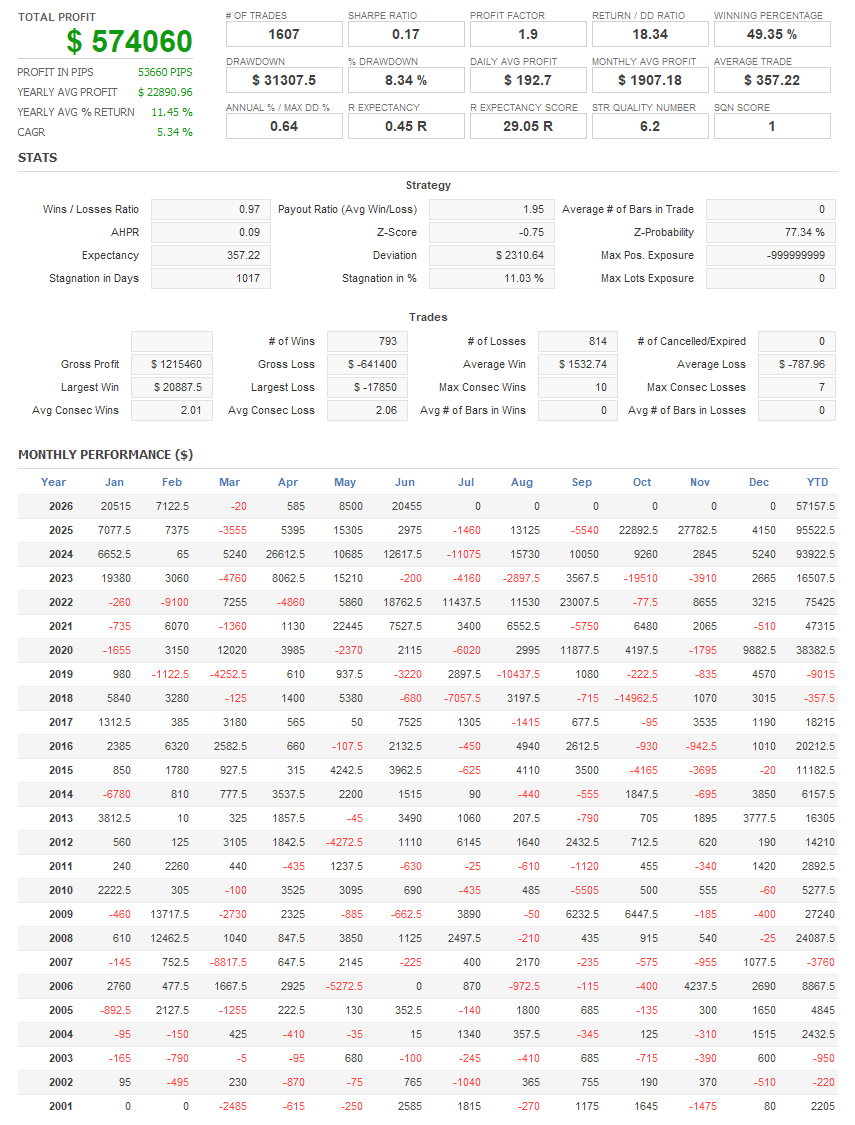
Return to Drawdown is one of the most important numbers here.
It tells us how much return we are getting for each dollar of drawdown. Higher is better because it means the strategy is using risk more efficiently.
The ORB alone had a Return / Drawdown of 9.86.
The RSI2 system alone had a Return / Drawdown of 14.17.
Combined, the portfolio moved to 18.34.
That is not a small improvement. That is the whole point of portfolio construction.
Compared to the ORB alone, the portfolio produced about 2.6 times the total profit, while drawdown only increased from $22,450 to $31,307.50. So yes, risk increased, but nowhere near the same rate as return.
That is what low correlation can do.
The portfolio did not just make more money because we blindly added more size. It made more money because the two systems behave differently. One is an ORB style strategy. The other is an RSI2 mean reversion style strategy with a VIX filter. They are not trying to make money from the same market behaviour.
And that is why the correlation of 0.02 is so important.
A 0.02 correlation means these two return streams are almost completely independent from each other. That is exactly what we want.
This is why I am a big believer in increasing exposure through more markets and more strategies, rather than just increasing position size on one system.
If you simply size up one strategy, you are increasing the same risk.
If you add another low correlation edge, you may increase return without adding the same level of pain.
That is the difference.
Stagnation Improves Too
Now let’s talk about the part most people avoid showing.
Stagnation.
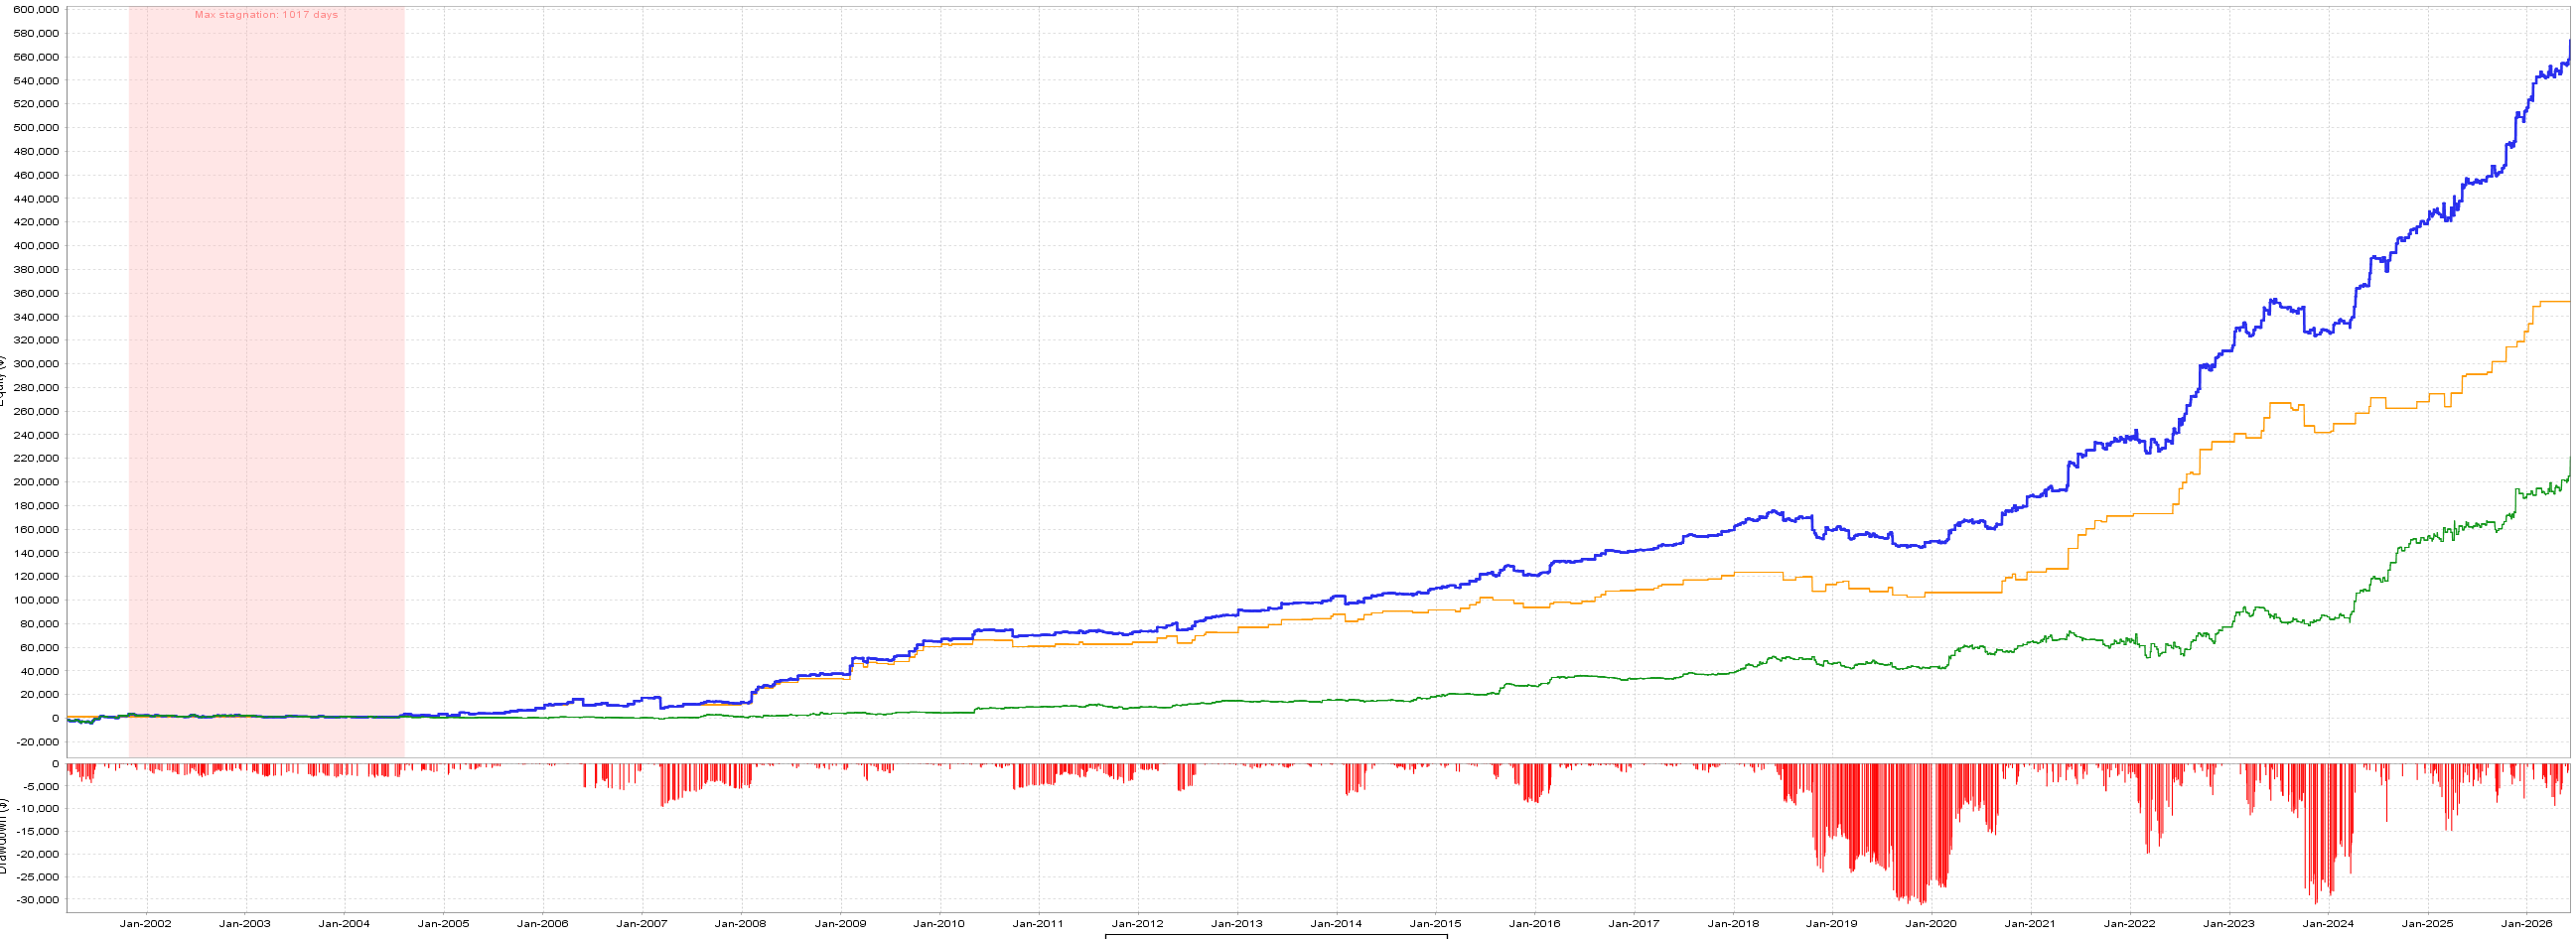
The pink shaded section on the equity curves highlights the stagnation period. This is the time where the strategy stops making new highs and effectively goes sideways. It may not look dramatic, but this is often the hardest part to sit through as a trader.
The NQ ORB alone had a max stagnation of 2,521 days.
That is a long time to sit in a system waiting for it to make new highs.
Now look at the combined portfolio.
The max stagnation dropped to 1,017 days.
Now, you are probably thinking:
“Hold on, 1,017 days is still a long time.”
And you would be right.
This is not me pretending the portfolio is perfect. A 1,017 day stagnation period is still difficult to sit through. But the important point is the direction of improvement.
We went from 2,521 days of stagnation on the ORB alone to 1,017 days in the two strategy portfolio.
That is a reduction of roughly 60% from adding just one low correlation edge.
This is one of the clearest examples of why portfolios matter.
The ORB did not suddenly become perfect. The RSI2 strategy did not suddenly remove all pain. But when combined, the quiet periods became much more manageable.
Now imagine what happens as the portfolio grows.
If we continue adding robust strategies that are genuinely uncorrelated, across different markets, timeframes, and trade behaviours, we should keep reducing the reliance on any single edge.
That does not mean stagnation disappears completely. It does not mean drawdowns vanish. It does not mean the portfolio becomes risk free.
But it does mean the portfolio becomes less dependent on one strategy having a good period.
That matters in the real world.
Because the hardest part of trading a system is not usually the entry logic. It is sticking with it when nothing is happening.
Most people quit during stagnation.
They stop trading right before the next good period. Or they start changing rules. Or they add size at the wrong time. Or they abandon a real edge because it feels broken.
A portfolio helps reduce that pressure.
Not because it removes drawdown.
Not because it eliminates bad periods.
But because different systems can carry the load at different times.
That is the actual edge.
Not one perfect strategy.
A group of good strategies that do not all suffer at the same time.
Why Influencers Avoid Long Track Records
This is also why you do not see many long form, 20 year strategy tests from the average trading influencer.
Of course, some people do show real research.
But the vast majority do not.
Why?
Because long track records expose everything.
They expose stagnation.
They expose regime changes.
They expose drawdown clusters.
They expose whether the idea only worked during one easy period.
A strategy that looks amazing over six months can look very ordinary over 20 years.
That does not mean it is useless. It means you need to understand where it fits.
This is why I care less about a single perfect equity curve and more about how strategies behave together.
The Bigger Lesson
The big lesson here is not that ORB is good.
It is not that RSI2 is good.
The lesson is that edges have seasons.
Every strategy has a period where it looks brilliant.
Every strategy has a period where it looks broken.
The portfolio is what helps you survive the gap between those periods.
This is why I would rather build a book of strategies than keep increasing position size on one system.
More size on one edge means more exposure to one pain cycle.
More edges with low correlation means better diversification.
That is the game.
Final Thoughts
The NQ ORB model is a strong strategy.
The ES RSI2 with VIX filter is a strong strategy.
But together, they are more useful than either one on its own.
The portfolio has:
Higher total profit
Higher profit factor
Higher Return/DD
Better average trade than ORB alone
Low correlation between components
Improved stagnation profile
That is why I keep saying the same thing:
The goal is not to find one perfect strategy.
The goal is to build a portfolio of good strategies that behave differently.
That is how you create something you can actually stick with.
Disclaimer
This publication is for education and research only. It is not financial advice. Results shown are hypothetical backtests and simulations. Past performance does not guarantee future results. Futures and derivatives involve substantial risk. You can lose more than your initial investment. Always validate on your own data, costs, execution, and infrastructure before trading live.