The Mean Reversion Portfolio That Had Only One Losing Year since 1998
How an IBS edge from Cesar Alvarez helped build a four strategy portfolio across RSI2, Turnaround Tuesday, IBS, and %B, producing $710,946 net profit with a 41.37 Return/DD ratio

Research and education only. Results are hypothetical and based on backtests and simulations. Past performance does not predict future results. Futures and derivatives involve significant risk. Test on your own data, costs, execution, and infrastructure before trading.
Most traders look for the next strategy.
I think the better question is this:
What happens when you start combining proven edges that behave differently from each other?
That is where this test became interesting.
I started with a simple mean reversion idea called IBS, or Internal Bar Strength. On its own, it is one of the cleanest ways to measure whether a market closed weak or strong relative to its own daily range.
Then I tested it across the major index futures.
Then I added it to a wider portfolio of strategies from previous research:


The goal was not to find the highest net profit strategy in isolation.
The goal was to create the best risk-adjusted portfolio.
That distinction matters.
A strategy can look amazing on its own and still be a poor portfolio component if it overlaps too heavily with what you already trade.
A strategy can also look simple on its own and become extremely valuable when added to the right mix of systems.
That is what happened here.
What IBS is measuring
IBS stands for Internal Bar Strength.
It measures where the market closes inside its own daily range.
If the market closes near the low of the day, IBS is low.
If the market closes near the high of the day, IBS is high.
That is the entire idea.
It is not trying to predict earnings.
It is not using macro data.
It is not forecasting next month.
It is asking one simple question:
Did the market close near the bottom of today’s range or near the top?
That matters because equity index futures have a long history of short-term mean reversion. When the market closes extremely weak, especially in a broad index, the next move often has a tendency to snap back.
Not always.
Nothing works always.
But as a behavioural tendency, it makes sense.
When price closes near the low of the day, it often reflects late-session fear, liquidation, forced selling, or short-term exhaustion. The next session can then see relief, short covering, or dip buying.
That is why IBS is such a useful concept.
It reduces the day to something very simple:
Did the market close near the bottom of today’s range or near the top?
Why I tested IBS across ES, NQ, and YM
One of the first things I want to know with any index strategy is whether the edge is isolated or broad.
If it only works on one contract, I get cautious.
If it works across ES, NQ, and YM, I get more interested.
The reason is simple.
ES, NQ, and YM are different instruments, but they are all major US equity index futures. If a short-term behavioural edge appears across all three, it suggests the model is capturing something broader than symbol-specific noise.
That is what happened here.
IBS worked across all three.
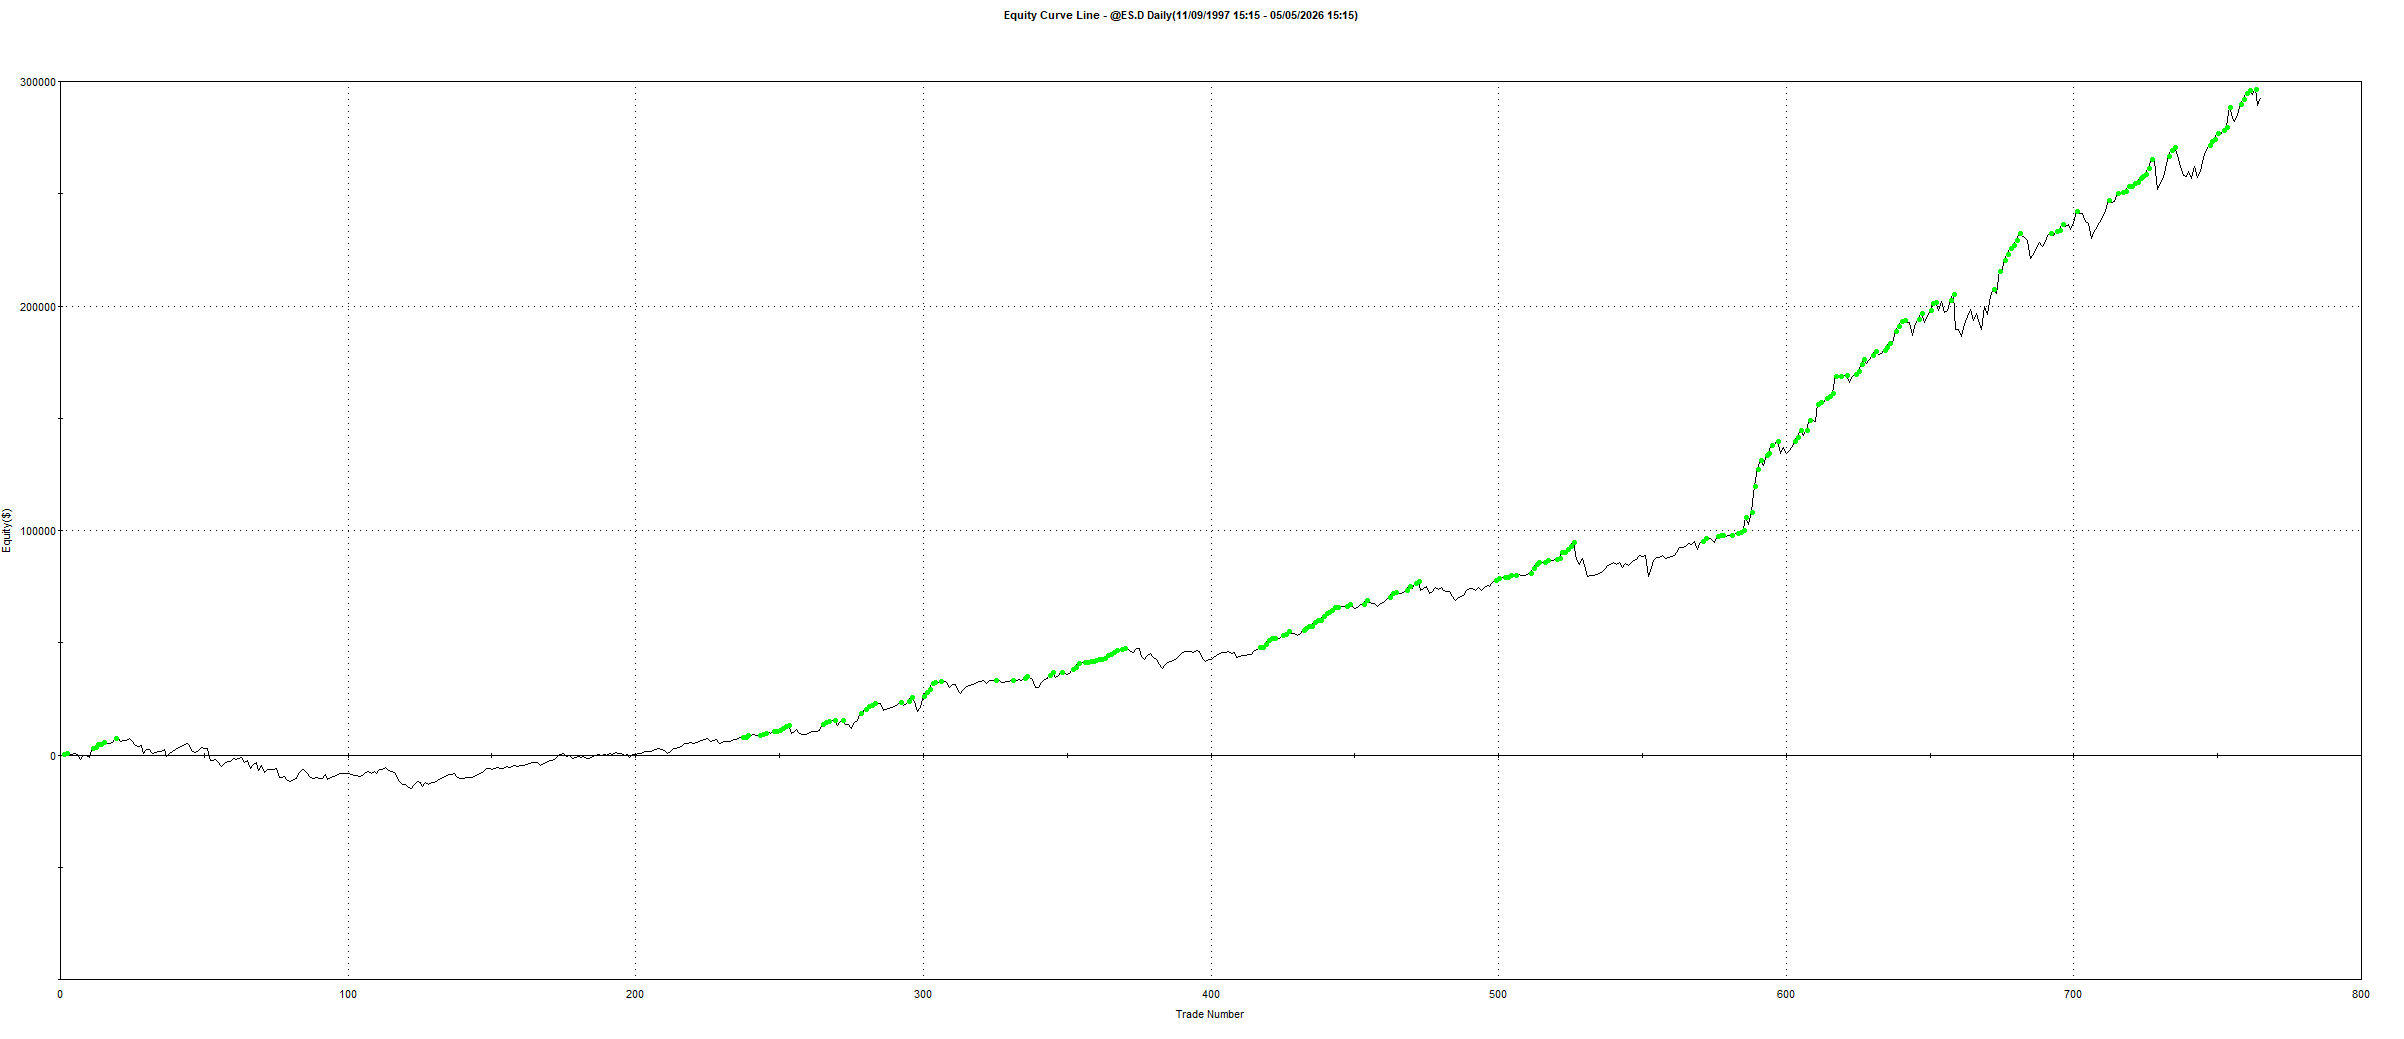
The ES test on a single contract no compounding produced:
Total Net Profit: $292,695
Total Trades: 765
Win Rate: 67.32%
Profit Factor: 1.72
Average Trade: $382.61
Largest Win: $11,400
Largest Loss: -$15,812.50
Trade Close Drawdown: $22,650
Intraday Drawdown: $43,487.50
Percent Time in Market: 36.38%
Annual Rate of Return: 4.91%
That is a strong standalone result.
But the important part is not just the total profit.
The important part is the structure.
The strategy has a high win rate, a decent average trade, and enough trades to give the sample some weight. It is not a 40-trade backtest pretending to be robust.
Then I tested NQ.
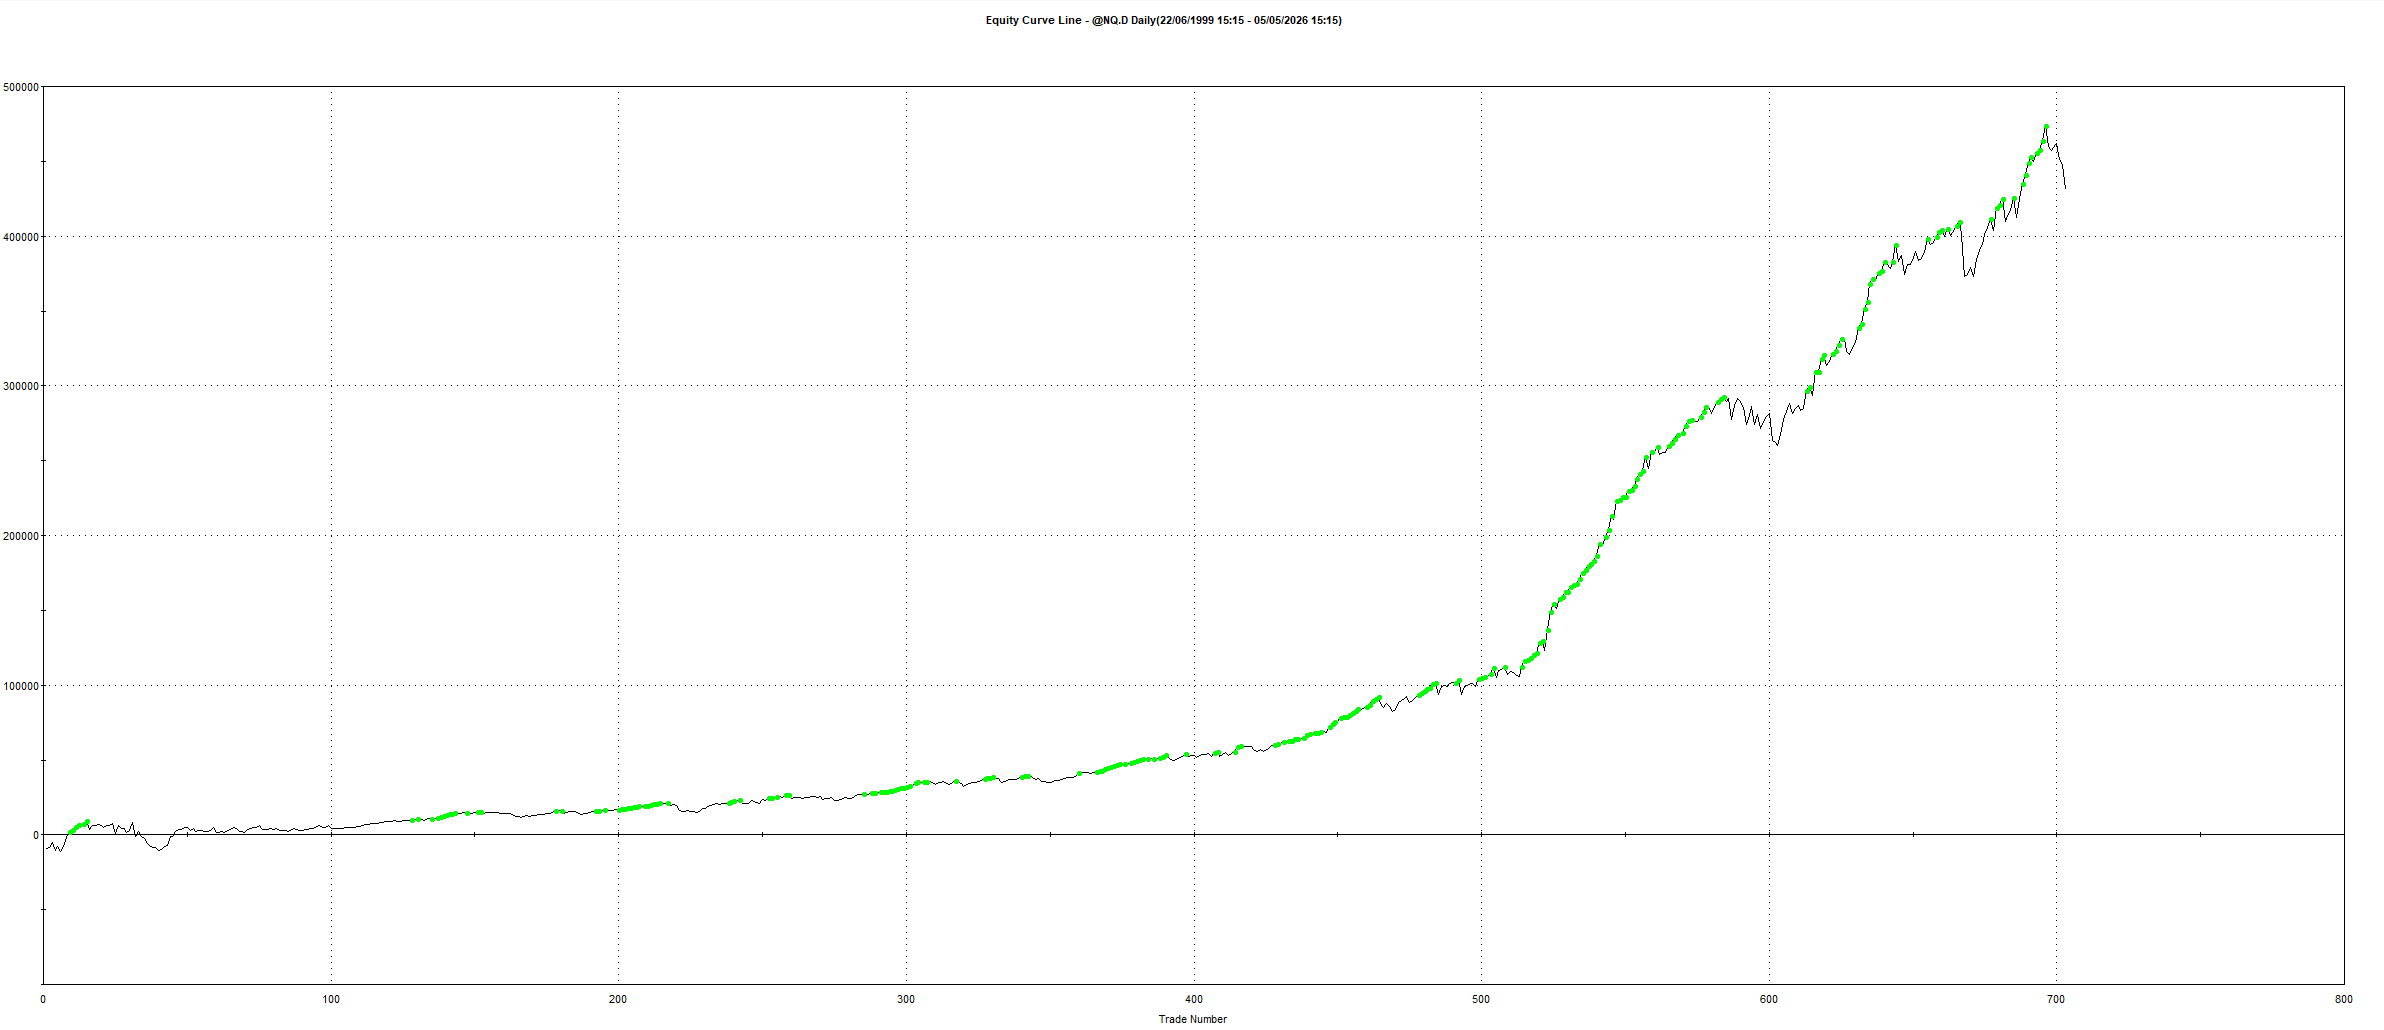
NQ was the strongest version in raw dollars.
That makes sense. Nasdaq futures generally carry more volatility, which means the same type of mean reversion effect can produce larger dollar swings.
Then I tested YM.
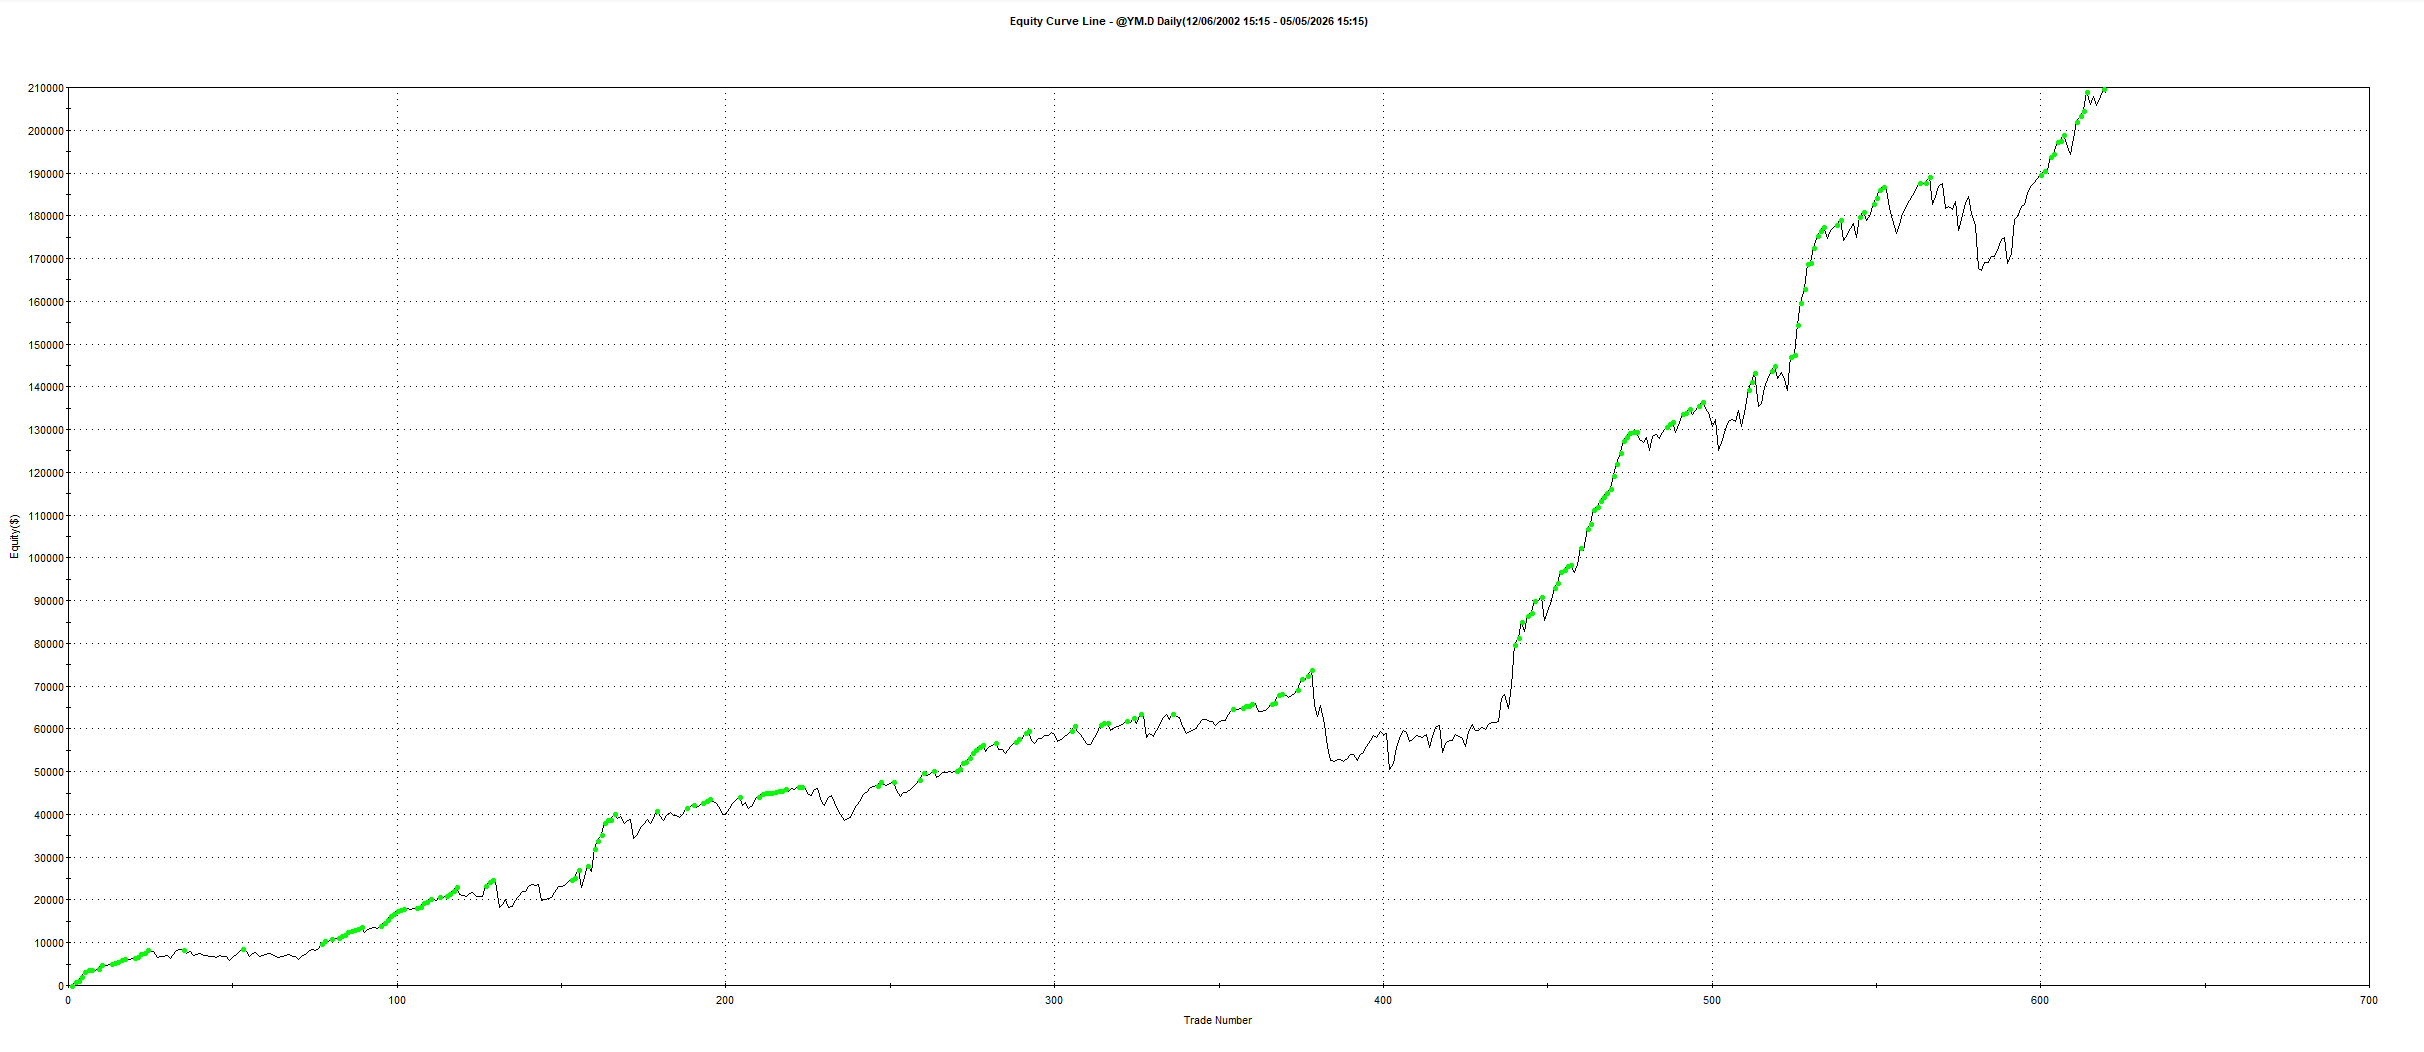
Again, profitable.
Again, similar behaviour.
That matters.
IBS is not just an ES curve fit. The same broad idea shows up across three major equity index futures.
The IBS only portfolio
After testing the instruments individually, the next step was to combine them.
The IBS-only portfolio across ES, NQ, and YM produced:
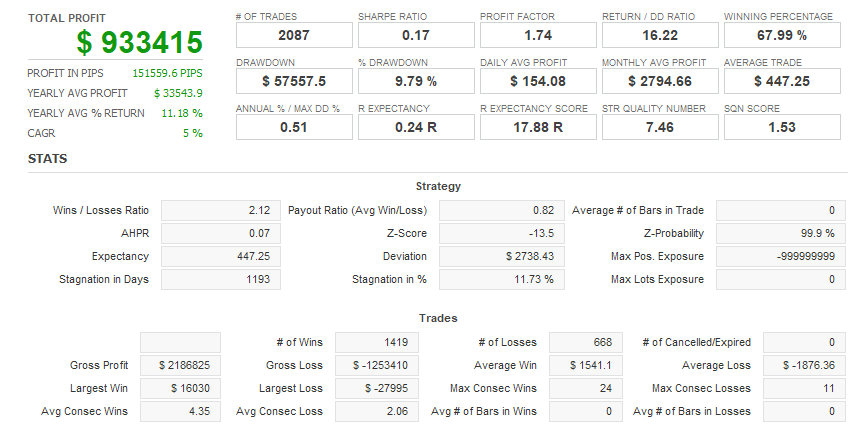
This is a solid result.
A 16.22 Return/DD ratio is strong.
Return/DD simply means how much profit the system produced for every dollar of maximum drawdown.
So a 16.22 reading means the IBS portfolio generated $16.22 of net profit for every $1 of maximum drawdown.
That is a very good number.
But there was a problem.
The IBS-only portfolio spent a lot of time in the market.
It was profitable, but it was still one family of ideas. It was the same concept applied across multiple index futures.
That is useful.
But it is not the final form of the portfolio.
The real question was:
Can IBS improve a broader mean reversion portfolio when combined with other edges?
Building the optimised portfolio
The next step was to add IBS into a group of strategies from previous articles and select the best combination based on risk adjusted performance.
The final portfolio used four different strategy families:
RSI2
A short-term oversold mean reversion model.
Turnaround Tuesday
A calendar-based behavioural reversal model.
IBS
A daily close-location mean reversion model.
Connors %B
A volatility-stretch pullback model.
These are all mean reversion strategies, but they do not trigger from the same information.
That is the whole point.
RSI2 looks at short-term momentum exhaustion.
Turnaround Tuesday looks at the weekly behavioural rhythm.
IBS looks at where the market closes inside the daily bar.
%B looks at where price sits inside a recent volatility envelope.
They are related, but they are not identical.
That is how you build a portfolio that is more than just one idea repeated four times.
Why correlation matters
Before combining strategies, I want to see how much they overlap.
If every strategy wins and loses at the same time, the portfolio is not diversified. It is just leveraged exposure to one idea.
The correlations were low across most of the portfolio components.
That is exactly what I want to see.
The strategies are not perfectly independent, but they are not moving as one block either.
The IBS strategy in particular had very low correlation to the other components.
That is what made it valuable.
Not just because it made money on its own.
Because it added a different return stream to the portfolio.
The final optimised portfolio
The optimised portfolio produced the following:
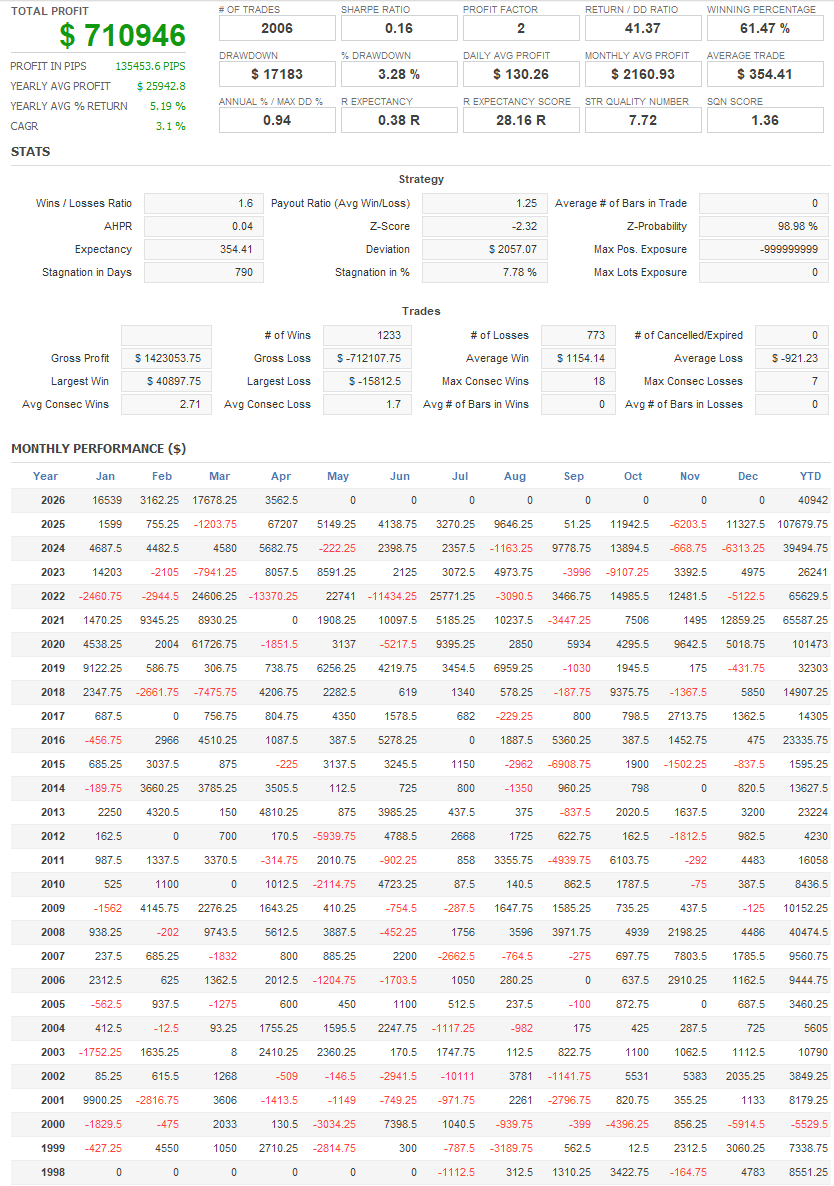
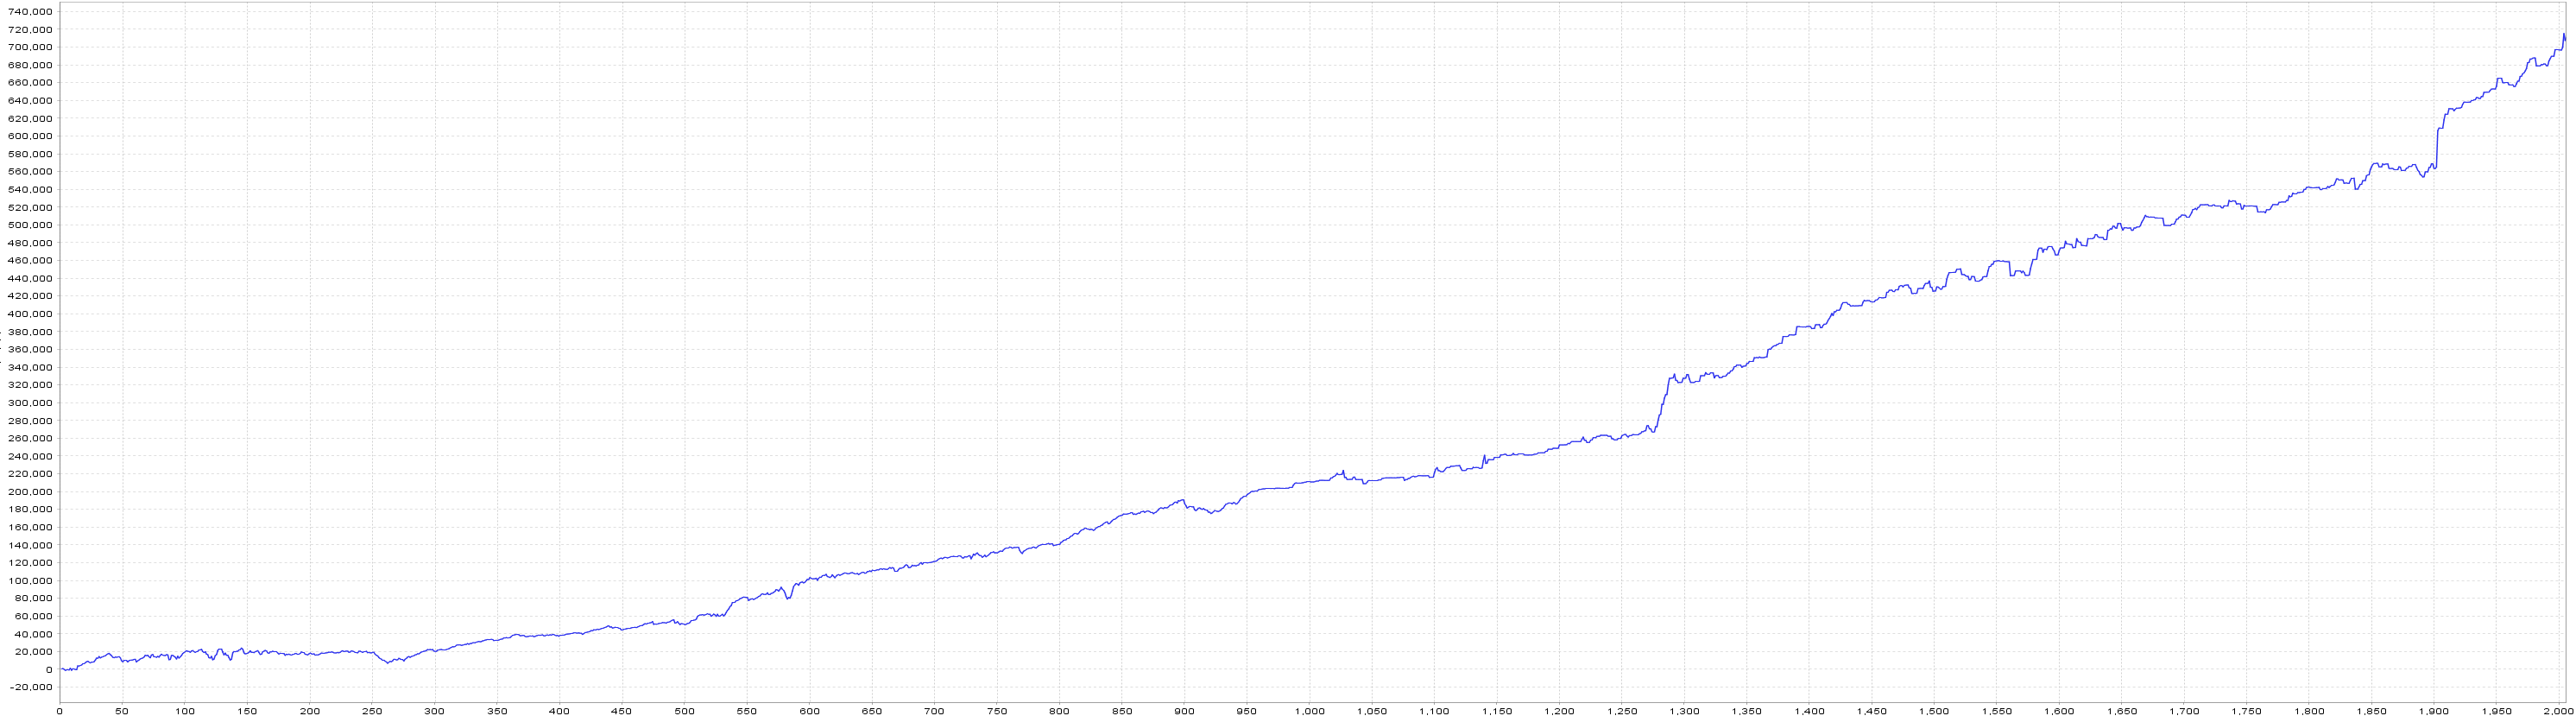
This is the result that stood out.
The portfolio made $710,946 with a maximum drawdown of only $17,183.
That gives a 41.37 Return/DD ratio.
That is not normal.
For every $1 of max drawdown, the portfolio generated $41.37 in net profit.
That is the kind of number you only get when the portfolio components are working together properly.
Not just making money.
Not just looking good separately.
Working together.
Why this portfolio is stronger than the individual parts
This is the main lesson.
The IBS portfolio by itself was good.
The Turnaround Tuesday portfolio by itself was good.
The Connors %B model by itself was useful.
The RSI2 model added another short-term mean reversion component.
But the best result came from combining them.
That is how systematic portfolios improve.
Not by trying to find one perfect strategy.
By stacking multiple imperfect edges that complement each other.
The individual systems each have weaknesses.
IBS can spend a lot of time in the market.
Turnaround Tuesday is selective and calendar-based.
%B is more specific to volatility stretch.
RSI2 can go through periods where oversold becomes more oversold.
But together, the combined portfolio becomes much stronger.
The weaknesses do not disappear.
They get diluted.
The strengths compound.
That is the real edge.
